Author Archives: Jose Antonio

Resistance Training is better than Aerobic Training for Weight Loss. Or is it?


By Dr. Deepak Hiwale. Leave it to the social media PhDs to pontificate on and on about the superiority of resistance training for weight loss. I recently saw a pyramid that touted sleep management over doing actual exercise (i.e., cardio) as better for you regarding fat loss. Now that’s a first. Thus,  we know resistance training is superior to aerobic training (aka cardio, endurance training, etc). And most fitness experts seem to agree. But is it really?500488709

Delve a bit deeper into science and you realise that evidence for RT being a better weight-loss tool, is not all that strong and AET (and in some individuals, high-intensity, interval training – HIIT) may be better! Interesting to note here that while RT may have its own set of metabolic benefits, AET may still be better than RT at reducing risks of metabolic disorders too.

Why are you told that resistance training will cause weight loss?

It is a common (and, somewhat dogmatic) belief amongst exercisers, exercise-fitness professionals and clinicians that resistance or strength training (ST), in addition to improving your lean body mass (LBM), is the best way to burn more calories and therefore, lose weight as well.

And, this is how – they’ll tell ya – it (apparently) works:

  • RT or ST has the potential to increase your LBM, also called fat-free mass (FFM), including muscle mass – there is enough evidence to support this 1–4
  • Skeletal muscle is the most metabolically active tissue in the body – well, no! Its more complicated than that (see below)
  • Increase in muscle mass translates into more calories burned throughout the day, even when resting – evidence equivocal (see below)
  • Therefore, more muscle you carry, more is your resting metabolic rate (RMR) and more calories you burn throughout the day (increase in total daily energy expenditure (TDEE)
  • Increase in TDEE (with or without a nutritional calorific deficit) leads to weight loss

What’s wrong with what they tell you?

While all that sounds good in theory, everything isn’t as cut and dry as they make it out to be:

  1. Skeletal muscle isn’t the most metabolically active of the tissues in the body – heart and the kidneys are! These organs have the highest metabolic rates, 2x those of the liver and the brain and a whopping 35x that of the skeletal muscle! 5Having said that though, of all the tissues, skeletal muscle may indeed contribute significantly towards energy expended during the day. This is so because skeletal muscle wins on account of sheer mass – it weighs much more than all these other organs mentioned.Sprinter Schippers 400 x 400
  2. Increased muscle mass does not bump up your metabolism to the point that it will burn additional calories which will translate into weight loss:
  • Previous studies examining the effects of RT on RMR have reported mixed results – both in men and women 2,3,6–15
  • Only older men (and not older women or younger men and women) show an elevated RMR in response to RT; most studies support this finding 2,3,6,10,11,13
  • In younger men & women and in older women, there seems to be a consistent lack of change in RMR in response to RT; the association between RT and rise in RMR all but disappears 7,8,12,14,15
  • Recent studies have shown mixed results too – with some showing an increase in RMR in response to RT; 16,17others, a no change. 18,19 Interestingly, one study showed a fall in RMR in response to ‘dieting’, which could not be stopped by resistance training 20
  • A rare study that compared the effects of RT on RMR across various age groups, reported no changes in RMR in either young or older individuals! 12
  • A study by Lemmer et al. 17reported some curious findings:
  1. RMR in response to RT is more affected by gender than age; men are more likely to benefit from RT than women
  2. When younger and older men were pooled together, a significant increase in RMR with RT was shown
  3. Younger and older women showed no effect on RMR in response to RT

In a nutshell, RT does not alter energy expenditure significantly outside of the exercise session and especially in younger men or in women across all age groups.

Weight / fat loss with resistance training

Misinterpretation of current ACSM and other guidelines 21–23 have led to the dogmatic belief amongst exercise-fitness professionals that RT has conclusively been proven to reduce body weight. In reality, a closer look at existing literature suggests that the evidence for RT as an effective tool for weight-loss remains equivocal, at best. 24–29

  • The ACSM guidelines on ‘strategies for weight loss and prevention of weight regain in adults’ states that, ‘research evidence does not support RT as effective for weight loss’ and points HMB chickout that ‘the effects of RT for prevention of weight gain (after initial weight loss) are largely unknown’ 21
  • While few studies have observed some reduction in body fat with RT,30–32others have found no effect on body fat % even when the intervention was continued for 12-52 weeks 33–35
  • Interestingly, one study found a gender-based differential effect of RT on body fat – reduction in body fat was observed in the group containing younger and older men pooled together but not in women. 17This finding is not dissimilar to the findings from other studies that RT enhances RMR only in older men 7,8,12,14,15

There is, however, a need to mention here that although RT does not seem to contribute significantly to calorie expenditure outside of the exercise session or fat loss, it is associated with numerous health benefits – increased lean mass, improved work capacity and decreased chronic disease risk factors (sarcopenia), to name a few. 36,37

High-intensity, Interval Training

HIIT, they will tell you, will not only burn calories during the workout but also increase your calorie expenditure through the rest of the day (through increased excess post-exercise oxygen consumption – EPOC – a fancy term the whole town and his wife seems to be using these days!). And, that will translate into weight loss!

EPOC or oxygen debt, as it used to be called previously, is the mechanism by which the body makes up for the oxygen deficit created during an exercise session by increasing oxygen consumption well after cessation of exercise – breathlessness you experience for a few minutes after you’ve climbed to the top of the stairs is an example.rowing

In reality, increase in EPOC after an HIIT session is modest (only 6-15% of total energy expenditure). EPOC alone, therefore, may be insignificant for causing weight loss. 38

Having said that, a study published in 2002 in the European Journal of Applied Physiology utilising circuit type of resistance training with relatively heavy weights and short rest periods generated EPOC which increased resting metabolic rate by 21% and 19% for 24 and 48 hours post- workout. As the authors content, if these numbers are applied to a typical 180-pound individual, it would amount to 773 calories expended over 2 days after cessation of the exercise session! 39 So, HIIT does seem to have benefits.

However, whereas in overweight-obese / untrained individuals, it is difficult to achieve the high-intensity and the duration required to elicit a high enough EPOC to be of any consequence for weight loss. And, prescription of such complex methods of training – needing highly skilled HIIT1movements – is likely to reduce exercise enjoyment and long-term adherence in novice and out-of-shape individuals, in seasoned exercisers, HIIT and EPOC may be an effective way to bump up calorie burning and improve body composition.

Aerobic endurance training

Also called ‘low-intensity, steady state’ (LISS) cardio or ‘long, slow distance’ (LSD) training, aerobic endurance training (AET) may just be the best tool out there, for most people when it comes to losing weight.

Researchers from the University of Pittsburgh, Pennsylvania, conducted a study comparing RT with AET in young women 40. The results will come as a surprise (for most)! Apparently, not only is AET better than RT at reducing body fat % but it also wins hands down when it comes to:

  • improving cardiorespiratory fitness
  • improving insulin sensitivity
  • reducing visceral adipose tissue (fat surrounding organs)
  • reducing abdominal fat, and
  • reducing inter-muscular (within muscle) fat

Other studies have also supported the idea that AET may be better at reducing visceral and Cycling_20-2abdominal fat, not to mention, the overall body fat%.
  • A study published in Dec, 2012 reported that while AET and combined AET/RT exercise programs caused more weight loss than RT alone, AET/RT and RT resulted in increased lean mass. However, although requiring a double time commitment over AET alone, a combined AET/RT exercise program did not result in ‘significantly more weight loss over AET alone’ 41
  • Another study published in the American Journal of Physiology – Endocrinology and Metabolism concluded that AET caused significant reductions in:
    1. Whole body fat including subcutaneous abdominal fat, visceral adipose tissue (VAT – fat around the organs) and liver fat content
    2. plasma liver enzymes, esp. alanine aminotransferase (enzyme reflecting the amount of liver damage), and
    3. HOMA (Homeostasis Model Assessment – a measure of the level of your steady state pancreatic beta cell function (%B) and insulin sensitivity (%S)

Resistance training, on the other hand, failed to significantly affect these variable 42

  • Owing to results like these, it shouldn’t come as a surprise that AET is recommended to be central to exercise programs for reducing VAT and its metabolic adverse effects – obesity and other metabolic disorders 43
  • Even in the absence of significant weight loss, AET may improve metabolic disease parameters, esp. in patients of type 2 diabetes 44

Women and aerobic endurance training

Why do women prefer conventional AET?

As if the results of the studies mentioned above didn’t come as shocking enough for you, here’s something that is even more thought-provoking – something that might answer your question of why women tend to favour treadmills over free-weights!

It appears that AET is more effective in (overweight and obese, both young and older) women than in men 40. Furthermore, there is some evidence to suggest that women enjoy AET more than RT 45; the opposite seems to be true with young men – they seem to enjoy RT more (now 6a013488ee9d3e970c01543533d8ce970ccome on, do we even need any proof of that?!).

My hunch is that is that women find AET more enjoyable because it is more effective for them! Not surprisingly then – call it nature or subconscious minds at work – there seems to be a very valid reason why you see more women heading to the treadmill rather than the ‘free-weights section’!

RT or AET and Metabolic Disease

Abdominal obesity is a prominent risk factor for metabolic disease (type II diabetes, cardiovascular disease, etc.). 46 Results from the STRRIDE study suggest that AET was associated with significant reductions in VAT, a measure of abdominal obesity. 47,48

Although in comparison to AET, RT does not cause much difference in measures of fat tissue, it does cause a significant reduction in CRP (a parameter, high levels of which, suggests a low-grade, chronic systemic inflammation with the potential to develop into cardiovascular disease and diabetes type II). 49 Important to note here that an inverse association seems to exist between aerobic fitness and chronic systemic inflammation.50,51  Sedentariness increases inflammatory markers. 49

Conflicting data exists over the superiority of AET over RT for the reduction of metabolic disease risk parameters (HbA1c, blood lipids including triglycerides and LDL particle size). Having said, regular and long-term, moderate intensity exercise seems to increase HDL and lower triglycerides, even in the absence of weight loss. 52

Although RT has benefits of its own, a combination of AET and RT exercise regimen – although more effective at reducing the risk of metabolic disease than RT alone – were not significantly different from AET alone 53. This effectively suggests that the RT component may be contributing precious little (if at all) to the disease prevention effect of an AET-RT exercise program.

A NEAT solution to the problem

Of all the components of human daily energy expenditure (BMR, thermic energy of food, exercise-related activity thermogenesis (EAT) and non-exercise activity thermogenesis (NEAT)), NEAT is the most modifiable parameter and is capable of significantly pushing up your total daily energy expenditure (TDEE) than exercise sessions (!), even in intense exercisers 54. Even very low-level physical activities like mastication (chewing) and fidgeting can increase energy girlsprintexpenditure by 20-40% above your resting metabolic rate! NEAT includes energy expenditure of walking, talking, going for your job, sitting, toe-tapping, shopping, dancing, etc. It should be apparent that this component (i.e., NEAT) has zero resemblance to resistance training.
Comment

It is likely that AET (treadmill runs) may be more effective than RT – especially in overweight women – for reducing body fat and preventing metabolic diseases. Also,

  • RT seems to contribute very little to weight-loss
  • RT doesn’t seem to contribute towards (metabolic) disease prevention-management as much as AET does
  • Combination of RT and AET does not seem to afford any more benefits over AET alone when weight loss or metabolic disease management is the prime goal

Conclusion

Looking at much of the evidence, the question that begs to be answered is: ‘what if we were all wrong about our weight-loss exercise strategies and indeed, about our obsession with the fat-burning abilities of resistance training? And, what if those women on treadmills were right all along?!

I reckon, it’s time we stopped ridiculing (or even downright laughing at) those men / women who hit the treadmill every single time they’re at the gym.

Take home message

  • Resistance training may be contributing precious little towards calorie burning outside of exercise sessions and eventual weight loss! Furthermore, gains in RMR subsequent to gains in lean body mass are miniscule.
  • HIIT in overweight – obese and untrained individuals HIIT may not be ideal; in seasoned exercisers, may lead to significant calorie expenditure both in and outside of the exercise sessions
  • Aerobic Endurance training seems to be the best tool for total body weight and fat reduction – needs to a be an integral part of almost every weight-loss program
  • Aerobic Endurance training wins hands down for metabolic disease management
  • Women do not seem to respond as well to resistance training, aerobic endurance training and HIIT may be better options
  • NEAT can contribute significantly to total daily energy expenditure – staying active through the day can really bump your calorific expenditure (probably more so than RT or AET)

About the Author: Facebook link: https://www.facebook.com/pg/drdeepakhiwale/about/?ref=page_internal

‘Conditioning Clinic’ is a brain child of Dr Deepak S Hiwale. Better known internationally as ‘The Fitness Doc, Dr Hiwale prefers and recommends a preventive approach to deal with metabolic diseases. He specializes in disease reversal – obesity, diabetes, cardiovascular diseases, you name it! He is also a strength and conditioning consultant and currently has club and elite cricketers as his clients!

References

  1. Byrne HK, Wilmore JH. The relationship of mode and intensity of training on resting metabolic rate in women. Int J Sport Nutr Exerc Metab. 2001;11(1):1-14. doi:10.1017/CBO9781107415324.004.
  2. Campbell WW, Crim MC, Young VR, Evans WJ. Increased energy requirements and changes in body composition with resistance training in older adults. Am J Clin Nutr. 1994;60(2):167-175. http://www.ncbi.nlm.nih.gov/pubmed/8030593. Accessed October 12, 2016.
  3. Poehlman ET, Toth MJ, Ades PA, Calles-Escandon J. Gender differences in resting metabolic rate and noradrenaline kinetics in older individuals. Eur J Clin Invest. 1997;27(1):23-28. http://www.ncbi.nlm.nih.gov/pubmed/9041373. Accessed October 11, 2016.
  4. Washburn RA, Donnelly JE, Smith BK, Sullivan DK, Marquis J, Herrmann SD. Resistance training volume, energy balance and weight management: rationale and design of a 9 month trial. Contemp Clin Trials. 2012;33(4):749-758. doi:10.1016/j.cct.2012.03.002.
  5. Wang Z, Ying Z, Bosy-Westphal A, et al. Specific metabolic rates of major organs and tissues across adulthood: evaluation by mechanistic model of resting energy expenditure. Am J Clin Nutr. 2010;92(6):1369-1377. doi:10.3945/ajcn.2010.29885.
  6. Ballor DL, Harvey-Berino JR, Ades PA, Cryan J, Calles-Escandon J. Contrasting effects of resistance and aerobic training on body composition and metabolism after diet-induced weight loss. Metabolism. 1996;45(2):179-183. http://www.ncbi.nlm.nih.gov/pubmed/8596486. Accessed October 12, 2016.
  7. Broeder CE, Burrhus KA, Svanevik LS, Wilmore JH. The effects of either high-intensity resistance or endurance training on resting metabolic rate. Am J Clin Nutr. 1992;55(4):802-810. http://www.ncbi.nlm.nih.gov/pubmed/1550062. Accessed October 12, 2016.
  8. Cullinen K, Caldwell M. Weight training increases fat-free mass and strength in untrained young women. J Am Diet Assoc. 1998;98(4):414-418. doi:10.1016/S0002-8223(98)00094-7.
  9. Pratley R, Nicklas B, Rubin M, et al. Strength training increases resting metabolic rate and norepinephrine levels in healthy 50- to 65-yr-old men. J Appl Physiol. 1994;76(1):133-137. http://www.ncbi.nlm.nih.gov/pubmed/8175496. Accessed October 12, 2016.
  10. Ryan AS, Pratley RE, Elahi D, Goldberg AP. Resistive training increases fat-free mass and maintains RMR despite weight loss in postmenopausal women. J Appl Physiol. 1995;79(3):818-823. http://www.ncbi.nlm.nih.gov/pubmed/8567523. Accessed October 12, 2016.
  11. Taaffe DR, Pruitt L, Reim J, Butterfield G, Marcus R. Effect of sustained resistance training on basal metabolic rate in older women. J Am Geriatr Soc. 1995;43(5):465-471. http://www.ncbi.nlm.nih.gov/pubmed/7730525. Accessed October 12, 2016.
  12. Rall LC, Meydani SN, Kehayias JJ, Dawson-Hughes B, Roubenoff R. The effect of progressive resistance training in rheumatoid arthritis. Increased strength without changes in energy balance or body composition. Arthritis Rheum. 1996;39(3):415-426. http://www.ncbi.nlm.nih.gov/pubmed/8607890. Accessed October 12, 2016.
  13. Treuth MS, Hunter GR, Weinsier RL, Kell SH. Energy expenditure and substrate utilization in older women after strength training: 24-h calorimeter results. J Appl Physiol. 1995;78(6):2140-2146. http://www.ncbi.nlm.nih.gov/pubmed/7665410. Accessed October 12, 2016.
  14. Van Etten LM, Westerterp KR, Verstappen FT. Effect of weight-training on energy expenditure and substrate utilization during sleep. Med Sci Sports Exerc. 1995;27(2):188-193. http://www.ncbi.nlm.nih.gov/pubmed/7723641. Accessed October 12, 2016.
  15. Van Etten LM, Westerterp KR, Verstappen FT, Boon BJ, Saris WH. Effect of an 18-wk weight-training program on energy expenditure and physical activity. J Appl Physiol. 1997;82(1):298-304. http://www.ncbi.nlm.nih.gov/pubmed/9029230. Accessed October 12, 2016.
  16. Kirk EP, Donnelly JE, Smith BK, et al. Minimal resistance training improves daily energy expenditure and fat oxidation. Med Sci Sports Exerc. 2009;41(5):1122-1129. doi:10.1249/MSS.0b013e318193c64e.
  17. Lemmer JT, Ivey FM, Ryan AS, et al. Effect of strength training on resting metabolic rate and physical activity: age and gender comparisons. Med Sci Sports Exerc. 2001;33(4):532-541. http://www.ncbi.nlm.nih.gov/pubmed/11283427. Accessed October 11, 2016.
  18. Hunter GR, Byrne NM, Sirikul B, et al. Resistance training conserves fat-free mass and resting energy expenditure following weight loss. Obesity (Silver Spring). 2008;16(5):1045-1051. doi:10.1038/oby.2008.38.
  19. Meckling KA, Sherfey R. Randomized Trial of Hypocaloric, High-Protein Diet on Body Compo, Resting Metabolic Rate – meckling2007.pdf. Vol 32.; 2007:743-752. doi:10.1139/H07-059.
  20. Geliebter A, Maher MM, Gerace L, Gutin B, Heymsfield SB, Hashim SA. Effects of strength or aerobic training on body composition, resting metabolic rate, and peak oxygen consumption in obese dieting subjects. Am J Clin Nutr. 1997;66(3):557-563. http://www.ncbi.nlm.nih.gov/entrez/query.fcgi?cmd=Retrieve&db=PubMed&dopt=Citation&list_uids=9280173.
  21. Donnelly JE, Blair SN, Jakicic JM, et al. American College of Sports Medicine Position Stand. Appropriate physical activity intervention strategies for weight loss and prevention of weight regain for adults. Med Sci Sports Exerc. 2009;41(2):459-471. doi:10.1249/MSS.0b013e3181949333.
  22. Pollock ML, Franklin BA, Balady GJ, et al. Resistance Exercise in Individuals With and Without Cardiovascular Disease. Circulation. 2000;101(7).
  23. Williams MA, Haskell WL, Ades PA, et al. Resistance Exercise in Individuals With and Without Cardiovascular Disease: 2007 Update. Circulation. 2007;116(5).
  24. Aldana SG, Greenlaw RL, Diehl HA, et al. Effects of an intensive diet and physical activity modification program on the health risks of adults. J Am Diet Assoc. 2005;105(3):371-381. doi:10.1016/j.jada.2004.12.007.
  25. Andersen RE, Wadden TA, Bartlett SJ, Zemel B, Verde TJ, Franckowiak SC. Effects of lifestyle activity vs structured aerobic exercise in obese women: a randomized trial. JAMA. 1999;281(4):335-340. http://www.ncbi.nlm.nih.gov/pubmed/9929086. Accessed October 11, 2016.
  26. Bravata DM, Smith-Spangler C, Sundaram V, et al. Using pedometers to increase physical activity and improve health: a systematic review. JAMA. 2007;298(19):2296-2304. doi:10.1001/jama.298.19.2296.
  27. Curioni CC, Lourenço PM. Long-term weight loss after diet and exercise: a systematic review. Int J Obes (Lond). 2005;29(10):1168-1174. doi:10.1038/sj.ijo.0803015.
  28. Dattilo AM, Kris-Etherton PM. Effects of weight reduction on blood lipids and lipoproteins: a meta-analysis. Am J Clin Nutr. 1992;56(2):320-328. http://www.ncbi.nlm.nih.gov/pubmed/1386186. Accessed October 11, 2016.
  29. Delecluse C, Colman V, Roelants M, et al. Exercise programs for older men: mode and intensity to induce the highest possible health-related benefits. Prev Med (Baltim). 2004;39(4):823-833. doi:10.1016/j.ypmed.2004.03.023.
  30. Ferrara CM, Goldberg AP, Ortmeyer HK, Ryan AS. Effects of aerobic and resistive exercise training on glucose disposal and skeletal muscle metabolism in older men. J Gerontol A Biol Sci Med Sci. 2006;61(5):480-487. http://www.ncbi.nlm.nih.gov/pubmed/16720745. Accessed October 11, 2016.
  31. Olson TP, Dengel DR, Leon AS, Schmitz KH. Changes in inflammatory biomarkers following one-year of moderate resistance training in overweight women. Int J Obes (Lond). 2007;31(6):996-1003. doi:10.1038/sj.ijo.0803534.
  32. Polak J, Moro C, Klimcakova E, et al. Dynamic strength training improves insulin sensitivity and functional balance between adrenergic alpha 2A and beta pathways in subcutaneous adipose tissue of obese subjects. Diabetologia. 2005;48(12):2631-2640. doi:10.1007/s00125-005-0003-8.
  33. Hunter GR, Wetzstein CJ, Fields DA, Brown A, Bamman MM. Resistance training increases total energy expenditure and free-living physical activity in older adults. J Appl Physiol. 2000;89(3):977-984. http://www.ncbi.nlm.nih.gov/pubmed/10956341. Accessed October 11, 2016.
  34. Hunter GR, Bryan DR, Wetzstein CJ, Zuckerman PA, Bamman MM. Resistance training and intra-abdominal adipose tissue in older men and women. Med Sci Sports Exerc. 2002;34(6):1023-1028. http://www.ncbi.nlm.nih.gov/pubmed/12048332. Accessed October 11, 2016.
  35. Schmitz KH, Jensen MD, Kugler KC, Jeffery RW, Leon AS. Strength training for obesity prevention in midlife women. Int J Obes Relat Metab Disord. 2003;27(3):326-333. doi:10.1038/sj.ijo.0802198.
  36. Frontera WR, Meredith CN, O’Reilly KP, Knuttgen HG, Evans WJ. Strength conditioning in older men: skeletal muscle hypertrophy and improved function. J Appl Physiol. 1988;64(3):1038-1044. http://www.ncbi.nlm.nih.gov/pubmed/3366726. Accessed October 11, 2016.
  37. Hurley BF, Redmond RA, Pratley RE, Treuth MS, Rogers MA, Goldberg AP. Effects of strength training on muscle hypertrophy and muscle cell disruption in older men. Int J Sports Med. 1995;16(6):378-384. doi:10.1055/s-2007-973024.
  38. LaForgia J, Withers RT, Gore CJ. Effects of exercise intensity and duration on the excess post-exercise oxygen consumption. J Sports Sci. 2006;24(12):1247-1264. doi:10.1080/02640410600552064.
  39. Schuenke M, Mikat R, McBride J. Effect of an acute period of resistance exercise on excess post-exercise oxygen consumption: implications for body mass management. Eur J Appl Physiol. 2002;86(5):411-417. doi:10.1007/s00421-001-0568-y.
  40. Lee S, Deldin AR, White D, et al. Aerobic exercise but not resistance exercise reduces intrahepatic lipid content and visceral fat and improves insulin sensitivity in obese adolescent girls: a randomized controlled trial. Am J Physiol Endocrinol Metab. 2013;305(10):E1222-9. doi:10.1152/ajpendo.00285.2013.
  41. Willis LH, Slentz CA, Bateman LA, et al. Effects of aerobic and/or resistance training on body mass and fat mass in overweight or obese adults. J Appl Physiol. 2012;113(12):1831-1837. doi:10.1152/japplphysiol.01370.2011.
  42. Slentz CA, Bateman LA, Willis LH, et al. Effects of aerobic vs. resistance training on visceral and liver fat stores, liver enzymes, and insulin resistance by HOMA in overweight adults from STRRIDE AT/RT. Am J Physiol Endocrinol Metab. 2011;301(5):E1033-9. doi:10.1152/ajpendo.00291.2011.
  43. Ismail I, Keating SE, Baker MK, Johnson NA. A systematic review and meta-analysis of the effect of aerobic vs. resistance exercise training on visceral fat. Obes Rev. 2012;13(1):68-91. doi:10.1111/j.1467-789X.2011.00931.x.
  44. Kadoglou NPE, Iliadis F, Angelopoulou N, et al. The anti-inflammatory effects of exercise training in patients with type 2 diabetes mellitus. Eur J Cardiovasc Prev Rehabil. 2007;14(6):837-843. doi:10.1097/HJR.0b013e3282efaf50.
  45. Lee S, Bacha F, Hannon T, Kuk JL, Boesch C, Arslanian S. Effects of aerobic versus resistance exercise without caloric restriction on abdominal fat, intrahepatic lipid, and insulin sensitivity in obese adolescent boys: a randomized, controlled trial. Diabetes. 2012;61(11):2787-2795. doi:10.2337/db12-0214.
  46. Alberti KGMM, Zimmet P, Shaw J. Metabolic syndrome–a new world-wide definition. A Consensus Statement from the International Diabetes Federation. Diabet Med. 2006;23(5):469-480. doi:10.1111/j.1464-5491.2006.01858.x.
  47. Strasser B. Physical activity in obesity and metabolic syndrome. Ann N Y Acad Sci. 2013;1281:141-159. doi:10.1111/j.1749-6632.2012.06785.x.
  48. Slentz CA, Aiken LB, Houmard JA, et al. Inactivity, exercise, and visceral fat. STRRIDE: a randomized, controlled study of exercise intensity and amount. J Appl Physiol. 2005;99(4).
  49. Donges CE, Duffield R, Drinkwater EJ. Effects of resistance or aerobic exercise training on interleukin-6, C-reactive protein, and body composition. Med Sci Sports Exerc. 2010;42(2):304-313. doi:10.1249/MSS.0b013e3181b117ca.
  50. Aronson D, Sheikh-Ahmad M, Avizohar O, et al. C-Reactive protein is inversely related to physical fitness in middle-aged subjects. Atherosclerosis. 2004;176(1):173-179. doi:10.1016/j.atherosclerosis.2004.04.025.
  51. Panagiotakos DB, Pitsavos C, Chrysohoou C, Kavouras S, Stefanadis C, ATTICA Study. The associations between leisure-time physical activity and inflammatory and coagulation markers related to cardiovascular disease: the ATTICA Study. Prev Med (Baltim). 2005;40(4):432-437. doi:10.1016/j.ypmed.2004.07.010.
  52. Carroll S, Dudfield M. What is the relationship between exercise and metabolic abnormalities? A review of the metabolic syndrome. Sports Med. 2004;34(6):371-418. http://www.ncbi.nlm.nih.gov/pubmed/15157122. Accessed October 18, 2016.
  53. Bateman LA, Slentz CA, Willis LH, et al. Comparison of aerobic versus resistance exercise training effects on metabolic syndrome (from the Studies of a Targeted Risk Reduction Intervention Through Defined Exercise – STRRIDE-AT/RT). Am J Cardiol. 2011;108(6):838-844. doi:10.1016/j.amjcard.2011.04.037.
  54. Levine JA. NEAT – Levine.pdf. Vol 62.; 2004:S82-97. http://www.ncbi.nlm.nih.gov/pubmed/15387473. Accessed October 16, 2016.
 

Gain Muscle, Jack Your RMR – Sorta?


Key Points

  • The number of calories you burn for every pound of lean body mass is equal to a cherry tomato.
  • Teleologically, it makes no sense for RMR to increase to any appreciable extent if one does gain lean body mass.
  • Heavy resistance training is great for pretty much everyone. But don’t be hoodwinked by the promise of a jacked up RMR.

By Jose Antonio PhD FNSCA FISSN CSCS – How often have you heard the following refrain? “To increase your resting metabolic rate, you need to lift weights. Putting on muscle is the sure-fire way to have the metabolism of a blue whale.” And that way, the fat will melt off your flabby belly like a stick of metabolic-ratebutter on a hot stove. Ok, I put the blue whale part in there. Blue whales can apparently consume half a million calories in one mouthful. Whoa. Can you say Thanksgiving buffet with every bite?! So does making those bi’s, tri’s and glutes a tad bit larger result in resting metabolism that’s copious, capacious or colossal? Or is this Much Ado About Nothing? Before I provide a teleological explanation of why this notion is cockeyed, here’s some food for thought.1, 2 According to Robert R Wolfe PhD, “every 10-kg difference in lean mass translates into a difference in energy expenditure of ~100 kcal/d.” Or in units us Americans prefer, that’s about an increase of 4.5 calories for every pound gained.2 Regardless of whether that number is entirely accurate, let’s just say RMR per unit of fat free mass is about as impressive as dunking a basketball on an 8 foot hoop.

Nonetheless, here’s an investigation that examined resting metabolic rate (RMR) pre and post resistance training. They looked at the effects of 24 weeks of strength training on RMR, energy expenditure of physical activity (EEPA), and body composition. For the purposes of this article, we’ll focus on RMR. They had subjects divided by age and sex: 10 young men (20-30 years), 9 young women (20-30 years), 11 older men (65-75 years) and 10 older women (65-75 years). They performed whole body resistance training 3/week for 24 weeks. Their baseline or pre- and post-training RMR were as follows:

Pre-training

Young men – 12.2 kcal/lb FFM/d

Young women – 13.5 kcal/lb FFM/d

Older men – 12.0 kcal/lb FFM/d

Older women – 13.6 kcal/lb FFM/d

Post-training

Young men – 12.8 kcal/lb FFM/d

Young women – no change

Older men – 12.8 kcal/lb FFM/d

Older women – no change

The first thing that stands out is that in both young and older women, their metabolic rate didn’t change at all. The other thing that stands out is how truly unimpressive the number of calories burned for one pound of fat-free mass (FFM). All groups increased FFM: +4.4 lb in young men, +4.18 lb in young women, +2.2 lb in older men, +1.98 lb in older women. In general, this study suggests that you burn roughly 12-13 kcal per pound of FFM daily. The authors of the study said that changes in absolute and relative RMR in response to heavy resistance training are influenced by sex but not age; that’s good news for us old guys.1

Pratley et al. looked at RMR after 16 weeks of resistance training in 13 healthy 50-65 year olds.3 They found that RMR before and after training was 11.8 kcal/lb FFM/d and 12.3 kcal/lb FFM/d. Interestingly, Broeder et al. found no change in RMR when adjusted for FFM.4

So what gives? Clearly there is quite a bit of variability in the RMR response to gains in FFM. Some folks gain, others nada. Maybe a sex difference exists with men responding better than women. Also, changes in RMR are not solely due to changes in FFM (or skeletal muscle mass). Perhaps it is related to changes in basal sympathetic nervous system tone. Alternatively,

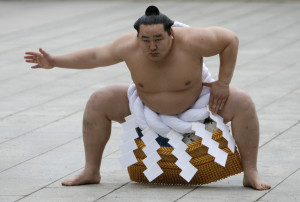
Mongolian-born grand sumo champion Yokozuna Asashoryu wears a ceremonial belly band as he performs a ring-entering ritual at Meiji Shrine in Tokyo January 7, 2008. Asashoryu was banned in August 2007 and fled to his homeland after he outraged fans when he was caught on video playing soccer while supposedly out of action with a back injury. REUTERS/Toru Hanai (JAPAN) - RTX5ATL

Mongolian-born grand sumo champion Yokozuna Asashoryu wears a ceremonial belly band as he performs a ring-entering ritual at Meiji Shrine in Tokyo January 7, 2008. Asashoryu was banned in August 2007 and fled to his homeland after he outraged fans when he was caught on video playing soccer while supposedly out of action with a back injury. REUTERS/Toru Hanai (JAPAN) – RTX5ATL

changes in organ mass (particularly in very large individuals such as sumo wrestlers) may also account for gains in RMR.5 Have you ever seen the distended guts of professional bodybuilders? That ain’t skeletal muscle. Nonetheless, one might argue that these small changes in RMR could account for significant changes over years and decades. And that certainly may be true. However, it is evident that trifling changes in diet can negate any increase in RMR. For instance, if you gained 5 pounds of lean body mass, that translates roughly into about 50 extra calories per day. That’s not even a mug of beer. Boo.

It makes no sense for RMR to increase significantly even with large gains in skeletal muscle. –  One of my favorite college classes as an undergrad was on Evolutionary Biology. The human animal (or heck any animal) has two primary objectives: survival and reproduction. If you can throw in a good sushi buffet, a cruise to the Bahamas, and the Cubs winning the World Series, than even better. Anyhow, getting back to evolution. Let’s take a trip back to the days when there was no running cavemen-food-nutritionwater or electricity. Man was left to fend for itself like any other wild animal. It helped having a big brain because there was no chance in hell that humans could use physical strength or speed to kill its next meal. Conversely, humans developed quite the endurance capacity to ‘out-work’ its prey and a brain to ‘out-think’ just about every creature on Earth. You’ll notice that even modern day hunter-gatherer societies are ‘endurance’ oriented. You need endurance just to stay alive. Having large muscles serves no survival benefit.

Now let’s say some wacky caveman found that lifting big rocks made his chest and arms bigger. Now pretend that for every pound he gained, that would be an extra 50-100 calories per day (urban legend says this figure is true). So a 5 lb gain, which is certainly attainable by even the most average of men, would result in an cavemanhunting-1160x683increased caloric need of 250-500 calories (according to the urban legend figure). Now where would a caveman get these calories? Would he open the fridge to get a protein shake? Go to Burger King and order a Whopper? Duh. It makes zero evolutionary sense for RMR to go up to any appreciable extent if you gain lean body mass. Or put another way. It is energetically costly to gain and maintain skeletal muscle mass. Why? Because you’d have to feed it you knucklehead. It makes evolutionary sense that it is difficult to gain muscle (which it is) and easy to gain fat (which it is). Why? So you can survive the next go round of the zombie apocalypse when an asteroid the size of Hawaii blasts Earth into a nuclear-winter oblivion. If that happens and you survive, you better pray that you have the genes for putting on fat easily. Otherwise, you and all the Victoria’s Secret models will shrivel to death in a matter of weeks.

Bottom line: Don’t believe the hype when folks say, “a great way to elevate RMR is by increasing skeletal muscle mass via resistance training.” Lifting weights does a lot of great things. In fact, heavy resistance training can help athletes of all kinds (i.e., endurance and strength-power). And yes it does increase muscle mass. But the change in RMR is like pissing in the ocean. And we all know what that’s like. Unless of course you live in Iowa.

About the Author – Jose Antonio earned his PhD at the University of Texas Southwestern Medical Center in Dallas. He completed a post-doctoral research fellowship there as well. His current research focus is on the effects of various ergogenic aids on body composition and performance. He is the CEO of the ISSN and an Associate Professor at Nova Southeastern University.13119931_10156866463875440_6050451888342188203_o

References

  1. Lemmer JT, Ivey FM, Ryan AS, et al.: Effect of strength training on resting metabolic rate and physical activity: Age and gender comparisons. Med Sci Sports Exerc 2001, 33:532-41.
  2. Wolfe RR: The underappreciated role of muscle in health and disease. Am J Clin Nutr 2006, 84:475-82.
  3. Pratley R, Nicklas B, Rubin M, et al.: Strength training increases resting metabolic rate and norepinephrine levels in healthy 50- to 65-yr-old men. J Appl Physiol (1985) 1994, 76:133-7.
  4. Broeder CE, Burrhus KA, Svanevik LS, et al.: The effects of either high-intensity resistance or endurance training on resting metabolic rate. Am J Clin Nutr 1992, 55:802-10.
  5. Midorikawa T, Kondo M, Beekley MD, et al.: High ree in sumo wrestlers attributed to large organ-tissue mass. Med Sci Sports Exerc 2007, 39:688-93.


What makes a scientist, a scientist?


As a university professor, I often get asked ‘what is a scientist?’ What do these geeks actually do? Fortunately, I teach a university-level Research Methods course. Thus, I have a mad-scientistforum for giving a somewhat elaborate response to my students. I think what’s confusing to the untrained or novel eye is that social media has witnessed a proliferation of those who claim to be ‘researchers.’ For the purpose of this article, I’ll treat ‘researchers’ and ‘scientists’ synonymously. Nevertheless, I will address the question of what exactly a scientist is. And more specifically, what a professional scientist actually does. Furthermore, I’m writing this from the standpoint of someone trained in the biological sciences because I’m not familiar with the manner in which chemists or physicists conduct ‘science.’ So to my students who have asked this question, I’ve finally put pen to paper, or more precisely, fingers to keyboard, and given you a somewhat limited answer to a rather complex question.

Key Points to Remember

  • Sitting in your Garanimals® while doing a PubMed search does not make you a scientist.
  • Being published in a peer-reviewed journal does not make you a scientist (I can see the confusion in many faces now).baby-typing-laptop-computer-keyboard-28598956
  • Professional scientists are typically involved in a series of steps that are unseen by non-scientists. In the short run, publication is the goal of professional scientists. In the long run, if you want to make a significant impact on our field, you need to conduct original investigations (i.e., generate original data).
  • Conducting original investigations is the hallmark of ‘doing science.’ If you’ve never done this, then you’re not a scientist. Review papers and meta-analyses are great for giving a ‘snapshot’ of the current state of science in a given field; however, they are not original investigations. They’re summaries of other original investigations (i.e., the work of other scientists).big-data-definition
  • It is easy to criticize a study. Students in my Research Methods class are often surprised as to the ease of finding limitations in studies published in peer-reviewed journals. However, try being the PI (principal investigator) of a study. When you walk a mile in someone else’s shoes, you’ll realize that banging your keyboard in the comfort of your underwear ain’t nothing like being the PI of a study. It’s the difference between being a movie critic and someone who makes movies.
  • You can indeed be very good at using the scientific method in your profession (e.g., personal trainer, dietitian, etc.) without being an actual scientist. I wholeheartedly implore everyone in the fitness-nutrition fields to embrace science. It would be like embracing medicine. You don’t have to be an MD to do that.

Let me outline the typical steps that a scientist performs before you, John Q. Public, can sit in your La-Z-Boy chair and leisurely read a peer-reviewed publication. I’m coming from a background of having done both extensive animal (i.e., rodents, birds, etc) and human research.1-7 The process is similar.lazboy

  1. Ideation phase – this is perhaps the most fun. Why? Because it’s free and anyone can do it. In this phase, you basically come up with an experimental idea. Interestingly, these ideas can arise at any time: while sunbathing, working out, or after consuming 6 beers. For instance, my idea of coming up with the initial high protein diet (4.4 g/kg/d) arose from a random conversation with a recreational bodybuilder who admitted to eating boatloads of protein.8 I asked myself: “what if we just got trained guys and girls to just eat a lot of protein?” Simple enough, right? Uh no. The hard part comes after this.
  2. Delineating the experimental protocol – now you put the pedal to the metal and write the IRB proposal (Institutional Review Board) and Informed Consent to submit to the university. If you work for a private clinical research organization or CRO, there are external IRBs that you can submit your proposal to. If you don’t like writing, you’ll hate this phase. At my university, it requires that you fill out a 20-page form. Yeah fun. Like stepping on a porcupine. I think pretty much every scientist dislikes this phase. Why? Because the folks who often review your IRB proposal are not experts in your particular field. Thus, the questions you receive regarding your protocol are often bizarre. But this is a hurdle every scientist must jump over before you initiate subject recruitment.irb_banner
  3. Subject recruitment – after getting IRB approval, which can take anywhere from 1 month (a rarity) to several months (for me, the average length is about 3 months), you subsequently initiate subject recruitment. This is perhaps one of the most misunderstood steps. First of all. It is difficult to recruit subjects for a study. In fact, getting the right subjects for a study is absolutely critical. For example, doing studies on untrained subjects is largely irrelevant to those who work with athletes. Why? Because untrained people respond to pretty much anything you throw at them. Yet many studies published in the sports sciences use untrained subjects. Why? Because the subject pool is enormous. When boneheads on Facebook lament the fact that a study has “only 20 highly trained cyclists (or any athletic group)” (meaning the sample size is ‘too small’ to be meaningful), it clearly underscores how little they know about research in general and subject recruitment specifically. Give me 20 highly trained athletes any day versus 60 untrained slobs.
  4. Data collection – I want to clear one thing up. If a study has 40 subjects for instance, it does not mean you pre- and post-test all 40 of them on the same days. Folks don’t understand why studies often take an inordinately long time. Once you’ve recruited subjects, data collection is typically staggered. Meaning, you get subjects in the lab (or field) when you can. Sometimes pre-testing a group of subjects can cover the span of months. Moreover, data collection requires its own unique set of skills. And like any skill, if you don’t use it, you lose it. Data collection would be akin to swimming in water. Reading about data collection would be like watching someone swim. Guess which is more difficult? The critiques I see on social media often underscore how little folks know about data collection. So unless you’ve actually jumped in the water, you will never truly know what it’s like to collect data. And the studies that are the absolute most difficult to do? Dietary intervention studies (i.e., comparing ketogenic vs. low carb vs. high carb vs. any random diet). I cringe a bit when I read social media critiques of diet studies. If folks only knew how difficult it is to ‘control’ these studies then one might get a better appreciation for these kinds of investigations. And there is a trade-off between control and real-world application. The more tightly a study is ‘controlled’ (e.g., metabolic ward diet studies), the less it resembles what free-living human beings do. The less tightly a study is controlled (i.e., getting highly trained, free-living subjects to comply with an intervention), the more applicability it may have to real life. Clearly both have their pros and cons.
  5. Data analysis – once you’ve collected all your data (the shortest time frame for collecting data-interpretation-tipsdata that I’ve done was 1 month; the longest was > 1 year), then the fun begins: interpreting the data. This is perhaps one of the more confusing steps for scientists-in-training (i.e., grad students). You can present the same data set to a dozen scientists and you may end up with a dozen different interpretations. In fact, it may be confusing to scientists themselves. Data
    interpretation requires that you have a solid background in the basic sciences (e.g., biology, chemistry, physics, math, etc). Furthermore, an extensive knowledge of the existing literature is key. Like any skill, this one requires practice, practice and more practice.
  6. Presentation at a science conference – prior to submitting a study (in the form of a manuscript) for publication in a peer-reviewed science journal, scientists will often present their data at a science conference. For instance, the International Society of Sports Nutrition conference has some of the latest research presented in the form of poster presentations and/or tutorials. If you fear public speaking more than sharks, then perhaps science ain’t the best career for you.
  7. Publication – writing a paper for publication is the ‘last’ step in the process. Though in jissnactuality, each study you do will likely lead to a different experimental question which in turn leads to another investigation. The mark of an excellent scientist isn’t just the ‘answers’ they arrive at, but the questions they generate. I actually enjoy writing. It’s like the icing on the cake. Writing for scientific journals is its own unique skill. There are some individuals
    who are amazing writers. Two of the very best I’ve read are Peter Lemon PhD and John Ivy PhD. Meanwhile, others are about as eloquent as a chimpanzee banging on a Mac Pro laptop. Inasmuch as English is now the language of science, English-writing skills are wso_monkey_team_absolutely critical for anyone who wishes to be a published scientist.
  8. Repeat steps 1-7

If you don’t do the steps outlined above, then you’re not a professional scientist. Anything less than the above dilutes the meaning of the word ‘scientist.’ The fact of the matter is that conducting original investigations is quite difficult. The notion that scientists can “control” all extraneous variables is very much a Sisyphean task.

But what if I’m published in a peer-reviewed science journal? Does that mean I’m a professional scientist? The simple answer to that is ‘no.’ They’ve basically skipped steps #1-7. Keep in mind that for many published papers, students and lab techs are often listed as co-authors. Does that mean they are now ‘scientists?’ Uh no. It’s like calling yourself a medical mybrainisfulldoctor because you wear a white lab coat, hang a stethoscope around your neck and watch re-runs of Grey’s Anatomy. The most important individuals listed on a scientific paper are the first and last (senior) author. The last author is typically the PI and runs the lab. The first author is often the person who does most of the data collection. Sometimes the PI is also the primary data collector. Not everyone follows this ‘rule’ so to speak. But most do. Either way, research is always a team effort. You need students, lab techs as well as your science colleagues.

You can still use the scientific method even if you’re not a scientist. You don’t have to be a scientist to be able to deftly use the scientific method in your daily life. In fact, you can be one helluva ‘thinker’ (in the scientific sense) and not be a scientist. For instance, personal trainers who use and embrace science and the scientific method are better trainers because of it. Why? Because rather than just being a parrot telling their clients what to do (because that’s what they were told when they were younger), they understand the ‘why’ of their advice. And if they don’t understand the ‘why’ of their advice, they’ll fully admit to not knowing. And that’s fine. The more you learn in this field, the more realize there’s a lot of stuff that you don’t know. The scientific method is the single most powerful way of thinking. Embrace it. Anecdotes are nice. But data trumps anecdotes.

BIO – I live in South Florida with my wife and twin daughters. I teach at Nova Southeastern University. I run the ISSN. I paddle in the ocean. I eat a lot. I have a daily beer or wine and last but not least, I worship the sun.miami-paddle-race

References

  1. Vierck J, O’Reilly B, Hossner K, et al.: Satellite cell regulation following myotrauma caused by resistance exercise. Cell Biol Int 2000, 24:263-72.
  2. Antonio J and Gonyea WJ: Skeletal muscle fiber hyperplasia. Med Sci Sports Exerc 1993, 25:1333-45.
  3. Bertocci LA, Fleckenstein JL, and Antonio J: Human muscle fatigue after glycogen depletion: A 31p magnetic resonance study. J Appl Physiol (1985) 1992, 73:75-81.
  4. Antonio J, Wilson JD, and George FW: Effects of castration and androgen treatment on androgen-receptor levels in rat skeletal muscles. J Appl Physiol (1985) 1999, 87:2016-9.
  5. Antonio J and Gonyea WJ: Progressive stretch overload of skeletal muscle results in hypertrophy before hyperplasia. J Appl Physiol (1985) 1993, 75:1263-71.
  6. Antonio J and Gonyea WJ: Role of muscle fiber hypertrophy and hyperplasia in intermittently stretched avian muscle. J Appl Physiol (1985) 1993, 74:1893-8.
  7. Antonio J and Gonyea WJ: Muscle fiber splitting in stretch-enlarged avian muscle. Med Sci Sports Exerc 1994, 26:973-7.
  8. Antonio J, Peacock CA, Ellerbroek A, et al.: The effects of consuming a high protein diet (4.4 g/kg/d) on body composition in resistance-trained individuals. J Int Soc Sports Nutr 2014, 11:19.


Junk Miles and Calories


Junk Miles and Calories – Sports vs Physique Nutrition by Jose Antonio PhD.

An Ephemeral Summary

  • Physique nutrition peeps focus on burning calories.
  • Performance nutrition peeps focus on getting better at a sport or activity.
  • Performance athletes should NOT burn extra calories.
  • There’s a term in distance running called “junk miles.”
  • We should add the term “junk calories” or “junk training” to the performance sports world (i.e. burning calories that serves no useful purpose).

The genesis of this article stems from my third cup of coffee (my fingers won’t keep still) and a talk given by Shawn Arent PhD at the ISSN-London conference titled “Physique vs Sports Nutrition – Are They Contradictory?” What’s interesting is how sports (i.e. performance) and physique nutrition have clearly diverged, particularly on one issue.pole vaulter

What’s the issue? Calories. How many times have you heard or read variations of the following: “RMR is higher when you blah blah.” “HIIT is better than SSC because your RMR is higher longer.” “You got to do this strategy and that strategy because you burn more frickin’ calories.”

The physique world’s obsession with calories is kinda funny actually. I mean it must really suck to have to ‘count’ your calories. I’d need an abacus to figure out how many calories I get from white rice alone. But I guess it goes hand in hand with the myriad of diet programs that basically focus on creating a caloric deficit. Folks who train for looks focus on burning calories the way a runway model focuses on her next meal of bread sticks and cheese. Feel the burn! Yowsah!

Yet in the performance world, you actually do not want to burn extra calories. Nobody in their right mind would tell an athlete, “okay, after you’re done bustin’ your ass on the field, in the gym, or wherever, I want to you to burn even more calories by walking around, doing non-exercise activities (i.e. NEAT), blah blah. In fact, you want to burn as few calories as possible once you’re done training. Why? Because you need to recover. The best thing for performance athletes to do after training is what? If you answered “nothing” go to the head of the class. I’d suggest the best thing to do is sit on your ass and watch Game of Thrones. Or even better, take a nap.Physique

There’s a term used in distance running called “junk miles” (i.e., run training that serves no specific purpose other than to up your mileage). Every workout (and this applies to ALL performance athletes) should have a specific goal in mind. To exercise (for the sake of exercise) is NOT how performance athletes should train. Distance runners, for instance, should not waste time and energy doing “junk miles” (i.e., running that has no specific goal). Each run should have a goal. Is it steady-state or LSD (long slow distance)? Is it SIT (sprint interval training)? Is it fartlek, a tempo run etc.? Training should be specific and goal-oriented. Baseball players train for hitting, fielding, base running etc. Going to the beach and playing ‘catch’ is junk training. No competitive baseball player in their right mind would do that. Other speed-power athletes (e.g., high jump, long jump, pole vault, sprints etc) should also avoid doing junk training just to burn calories.London_Olympics_Beach_Volleyball_Women_t1930

In Conclusion

  • In the physique world, it must really suck to count calories in/calories out.
  • In the performance world, if you train your ass off and eat well most of the time, believe it or not, body composition (i.e. physique) takes care of itself most of the time.
  • I’ve had athletes come to my lab who are weight stable with body fat percentages in the mid- to low-teens (some in the single digits).
  • None of them count calories.
  • In fact, they don’t really count anything.
  • They just train like maniacs and eat food.


Implementing low carbohydrate availability training- Part 2

Kedric Kwanby Kedric Kwan CISSN. There is definitely a discrepancy between mitochondrial adaptation and performance. After reading the literature, there are a few factors that needs to be accounted for during the implementation to optimise both the mitochondrial adaptation and performance outcome. The first factor is to ensure that the second bout of exercise is commenced with low muscle glycogen levels.Cycling_20-2

Not doing so might not facilitate the desired adaptation which can translate to performance. This could be seen in an acute study done by Cochran and colleagues (2010) who had 10 active males participated in a trial where they were split into two groups, both groups performed 5 x 4 minutes bout of cycling at 90-95% heart rate reserve followed by a 3 hour recovery where both groups consumed the drinks provided. One group ingested a high carbohydrate drink (HI-HI) and the other ingested a placebo drink (HI-LOW). After the 3 hour recovery, the same exercise protocol was repeated. The HI-LOW group showed greater increased of p38 MAPK compared to the HI-HI group. However the increase of PGC-1α and cytochrome c oxidase (COX IV) mRNA which plays a role in the synthesis of ATP increased with no difference between groups. This is due to the fact that both groups started the second bout of exercise with similar muscle glycogen content.

In addition, to further emphasize the importance of muscle glycogen content, two different studies measured the activity level of AMPK. Using a cycling model one study showed that AMPK levels were not different in both groups despite one group consuming CHO during exercise (Lee Young et al., 2006). This was in contrast to the result by Akestrom et al (2006) which showed a higher increase in the group that consumed a placebo drink. This could be caused by the different exercise mode used in the experiments due to a cycling model used rowingby Lee Young and colleagues whereas Akestrom and colleagues used a single knee extensor model. The nature of the single knee extensor model is highly concentrated and possibly targeted the carbohydrate glucose supplementation which spared muscle glycogen which explains the difference in findings between the two studies. Another interesting study found that carbohydrate ingestion during endurance exercise resulted in similar increases in CS levels with the placebo group. An incremental maximal cycling test also showed similar improvements in both groups (Nybo et al., 2009). This was also only conducted after an overnight fast with no glycogen depletion prior which further indicates the role of glycogen on these adaptations.

The last study that really cements the role of muscle glycogen is done by Lane and colleagues (2015) This study was done to examine the effects of sleeping with low carbohydrate availability on acute training responses and this showed greater upregulation of signalling proteins involved in fat oxidation but fail to show an increase of upregulation of markers of mitochondrial biogenesis. The participants recruited in this study were highly trained and it is well documented that trained individuals have a higher capacity to store glycogen compared to untrained. Despite muscle glycogen content was reduced by 50% but because of the high level of starting muscle glycogen, participants started the second exercise bout with reduced muscle glycogen but the levels were not low enough to illicit changes in mitochondrial adaptation that was hypothesized to occur. This shows that the actual content of muscle glycogen seems to play a larger role than the relative amount of runningmuscle glycogen. What is the sweet spot for muscle glycogen content to illicit a response is still unclear and hopefully future research will shed some light on it.

The more trained you are, the greater cellular disruption you would need to cause an adaptation, hence there seems to be an inverse relationship between training status and muscle glycogen level. The more well trained you are, lower muscle glycogen levels might be needed to create additional adaptation. If you’re relatively untrained, performing exercise after a long bout of fasting might be able to cause some form of improvement.

Another factor that to take into account during implementation is the intensity or stimulus from the training bout. As mentioned above, p38 MAPK is one of the regulators of the master regulator of mitochondrial biogenesis, PGC-1 α. Research have shown that p38 MAPK is sensitive to the stress that is being imposed during training and it is also regulated by the reactive oxygen species (ROS) induced during exercise. In fact, oxidative stress seems to be higher after a short bout of high intensity exercise compared to a submaximal steady state exercise (Olcina et al., 2008) further showing the role of intensity in regulating this protein. The hypothesis that higher exercise intensity would cause higher oxidative stress leading to higher levels of p38MAPK seems valid. Hence, a constant intensity might not be able to illicit significant adaptation for the trained athlete.

The other upstream protein, AMPK seems to response to exercise stimulus and intensity as well. Nielsen and workers (2002) showed that at the end of a 20 minute exercise bout at 80% VO2max AMPK levels were reduce.d This is possibly due to the fact that AMPK response to a change to the initial bout of intensity and reduces thereafter. Another study showed that AMPK activation was lowered after 3 weeks of moderate intensity at the same workload. This could be caused by the initial adaptation to the initial stimulus and that intensity wasn’t sufficient to further induce additional adaptation in later stages (McConell et al., 2005).13119931_10156866463875440_6050451888342188203_o

Most training bouts used in the studies used fixed bout of exercise, an example from one study used a high intensity training model consisting of 8 x 5 minutes of all-out effort alternating with 1 minute of recovery for 3 weeks (Hulston et al., 2010). It is possible that because the exercise bouts did not increase, a “tolerance” was built up to it. Hence a reduced stimulus of exercise intensity took place further into the training intervention. Moreover, how much time of the 5 minute all-out effort was actually maximal effort because I doubt that anyone could sustain an all-out effort for 5 minutes. Shorter bouts of all-out efforts such as the one used in Sprint Interval Training (SIT) might be able to elicit a stronger stimulus. In fact, Granata et al (2015) showed that SIT actually increased PGC-1 α and p53 much higher than regular high intensity training or sub-lactate threshold training even though total work done was lower in the SIT group. However, this study was not done in a limited carbohydrate availability state but the importance of intensity should be noted from this study. Given that the activation of these two upstream regulators responses to the exercise stimulus and intensity, it make sense that some form of progressive overload is needed to induce some form of additional improvement that could translate into performance.

In a discussion with Professor John Hawley (you should know who he is, if you don’t, you haven’t been reading up enough) he said that currently measurement tools might not be sensitive enough to show a statistical significance on performance when training with a reduced carbohydrate availability, so if tools aren’t sensitive enough, the only possible way I could think of is to create additional performance large enough to be detected. While the verdict on performance isn’t actually out yet, future studies that is conducted with much better methods might actually create more performance changes using a “train low” method strategically.

For the general lay person wanting to implement some form of reduced carbohydrate availability training, you could probably start by doing some form of fasted exercise or simply performing two bouts of exercise with no carbohydrate in between sessions. While the exact amount of muscle glycogen depletion would not be accurate, I believe most readers here aren’t elite endurance athlete hence there might still be small additional benefits to us.

A very interesting study I would like to conduct which would benefit meathead powerlifters like myself would be to actually examine if performing resistance training with reduced glycogen availability could improve endurance performance compared to actually performing resistance training in a carbohydrate fed state. If this hypothesis works, simply restricting carbohydrate consumption prior to lighter lifting sessions might actually improve our aerobic capacity without the need of too much additional cardio.

And yes, despite being a powerlifter, I still see the importance of the aerobic system so if it’s possible to kill two birds with one stone solely through lifting, I would be highly interested to do a study as such.

Take home message: As far as the evidence would suggest, training with low glycogen/carbohydrate availability and periodizing it to a well thought of training schedule can bring about additional benefits. No study have shown a decrement in performance which would be a relief to most wanting to experiment with it.gym-treadmill-use

This field of research is relatively new and there would definitely be more studies coming out in the near future. I hope I’ve given some insight on the mechanism behind how low glycogen/carbohydrate availability training works and the physiology and biochemistry lessons didn’t bore you out of your minds!

Fun Reading for My Fellow Geeks

Akerstrom, T., Birk, J., Klein, D., Erikstrup, C., Plomgaard, P., Pedersen, B. and Wojtaszewski, J. (2006). Oral glucose ingestion attenuates exercise-induced activation of 5’-AMP-activated protein kinase in human skeletal muscle. Biochemical and Biophysical Research Communications, 342(3), pp.949-955.

Cochran, A., Little, J., Tarnopolsky, M. and Gibala, M. (2010). Carbohydrate feeding during recovery alters the skeletal muscle metabolic response to repeated sessions of high-intensity interval exercise in humans. Journal of Applied Physiology, 108(3), pp.628-636.

Granata, C., Oliveira, R., Little, J., Renner, K. and Bishop, D. (2015). Training intensity modulates changes in PGC-1α  and p53 protein content and mitochondrial respiration, but not markers of mitochondrial content in human skeletal muscle. The FASEB Journal, 30(2), pp.959-970.


Hulston, C., Venables, M., Mann, C., Martin, C., Philip, A., Baar, K. and Jeukendrup, A. (2010). Training with Low Muscle Glycogen Enhances Fat Metabolism in Well-Trained Cyclists. Medicine & Science in Sports & Exercise, 42(11), pp.2046-2055.


Lane, S., Camera, D., Lassiter, D., Areta, J., Bird, S., Yeo, W., Jeacocke, N., Krook, A., Zierath, J., Burke, L. and Hawley, J. (2015). Effects of sleeping with reduced carbohydrate availability on acute training responses. Journal of Applied Physiology, 119(6), pp.643-655.


Lee-Young, R. (2006). Carbohydrate ingestion does not alter skeletal muscle AMPK signaling during exercise in humans. AJP: Endocrinology and Metabolism, 291(3), pp.E566-E573.

McConell, G., Lee-Young, R., Chen, Z., Stepto, N., Huynh, N., Stephens, T., Canny, B. and Kemp, B. (2005). Short-term exercise training in humans reduces AMPK signalling during prolonged exercise independent of muscle glycogen. The Journal of Physiology, 568(2), pp.665-676.


Nielsen, J., Mustard, K., Graham, D., Yu, H., MacDonald, C., Pilegaard, H., Goodyear, L., Hardie, D., Richter, E. and Wojtaszewski, J. (2002). 5′-AMP-activated protein kinase activity and subunit expression in exercise-trained human skeletal muscle. Journal of Applied Physiology, 94(2), pp.631-641.


Nybo, L., Pedersen, K., Christensen, B., Aagaard, P., Brandt, N. and Kiens, B. (2009). Impact of carbohydrate supplementation during endurance training on glycogen storage and performance. Acta Physiologica, 197(2), pp.117-127.

Olcina, G., Munoz, D., Timón, R., Maynar, M., Robles, M., Caballero, M. and Maynar, J. (2008). Oxidative Stress And Antioxidant Response In Trained Men After Different Exercise Intensities. Medicine & Science in Sports & Exercise, 40(Supplement), pp.S384-S385.


The Case for Carbs – Part 1


by Kedric Kwan CISSN. The world of carbohydrates can be one plague with controversy. It seems like people tend to polarize the intake of carbohydrates from either completely low to no carbohydrate or having a high carb diet all day, every day. It’s either cotton candy or some gross sugar-free substitute. And somewhere in that morass of social media confusion, lies the truth.sport_drinks

When the role of carbohydrate is concerned, it is mainly involved in keeping muscle glycogen and blood glucose elevated to facilitate exercise performance.

Classic studies have shown the role skeletal muscle glycogen content plays in sustaining exercise or sporting performance. My favourite one in particular is this study done in soccer players. The finding of the summary is in the table below:

High Glycogen Low Glycogen
Muscle glycogen at start of game: 100% 50%


Muscle glycogen at half time: 40% 7%
Muscle glycogen at full time: 10% 0%
Distance covered first half 6,100m 5,600m
Distance covered second half 5,9000m 4,1000m
Total distance covered 12,000m 9,7000m
Percentage walking 27% 50%
Percentage sprinting 24% 15%

This study basically showed that the football players with higher glycogen covered a staggering 1,300m more and sprinted more and walked less compared to the ones who had low muscle glycogen (Saltin 1973).

I don't like white rice said no Asian ever.

I don’t like white rice said no Asian ever.

You should be convinced now that carbohydrates do play a huge role in both exercise and sporting performance. However, just because something is good doesn’t mean that constantly consuming a ton if it will bring additional benefits.

In the endurance world, performance is definitely affected by carbohydrates and recent studies have indeed demonstrated that (Leckey et al., 2015, Torrens et al., 2016). However, in 8 longitudinal studies evaluating the relationship between a high carbohydrate diet (HCHO) and moderate carbohydrate diet (MCHO), 5 studies showed no difference in performance improvement of HCHO compared to MCHO when it came to the actual performance test (Burke et al., 2004).

This leaves us with the question, is constantly having high carbohydrate availability the best way to maximize endurance performance? Or could strategically periodizing phases of training with low carbohydrate availability enhance performance to a greater extent?

Mitochondrial physiology

In order to fully understand the content of this article we need to understand a little physiology of endurance performance. Besides the role the heart plays, the two ways someone can increase their endurance performance is by increasing the number of mitochondria also known as mitochondria volume density or by improving mitochondrial function. This article will focus mainly on the increasing of mitochondrial volume density also known as mitochondrial biogenesis, instead of its function.

Mitochondria is the site where energy in the form of ATP is produced so the more mitochondria we have, the more ATP we can produce which theoretically leads to an improvement of performance. Since the improvement of performance could be thought of the accumulated response from an acute exercise bout, constant training would result in an improvement of endurance performance through increased mitochondrial volume.outrigger-canoe

Something that governs the increase of mitochondria is the transcription factor called Peroxisome proliferator-activated receptor gamma coactivator 1-alpha (PGC-1α). This has been labelled as the “master regulator” of mitochondrial biogenesis and training in a state of reduced carbohydrate availability seems to augment this by upregulation upstream regulators and protein kinases that are involved in the signalling pathway for mitochondrial biogenesis.

One of the major protein kinases that up regulates PGC-1α is the protein kinase called AMP- activated protein kinase (AMPK). This protein responses mainly to energy availability and the ratio of AMP to ATP, a higher level of AMP concentration simply signals that energy availability is low and AMPK will be upregulated (Alexander and Walker, 2011). Another protein kinases is the p38 mitogen-activated protein kinase (p38 MAPK) which is a protein that is sensitive to stress that takes place during exercise mainly in the form of cellular perturbation and oxidative stress. This two proteins act downstream on PGC-1α, increasing it’s activity hence up regulating mitochondrial biogenesis.

Besides PGC-1α, another protein called p53 has also been implicated in the role of mitochondrial biogenesis. Similar to how PGC-1α is upregulated by AMPK and p38 MAPK, p53 is also one of the downstream targets of those proteins.

Training with low carbohydrate availability – the evidence.

One of the most common ways to reduce carbohydrate availability is to train twice a day without ingesting any form of carbohydrate after the first exercise bout. What happens when exercise is commenced with low carbohydrate availability is that the cellular perturbation is increased and energy availability would be greatly reduced hence AMPK and p38 MAPK activity would increase and act on it’s downstream targets. This was first seen in a study done by Hansen and workers (2005) in which they recruited a group of seven untrained males and have them perform single leg knee extensions at 75% maximal power out (Pmax). One leg trained twice a day, every other day (LOW) while the other once a day, every day (HIGH). This training runningprotocol lasted 10 weeks. Only water was ingested while training the LOW leg to ensure that the second bout of training was commenced with lower glycogen stores while the HIGH leg that was trained once every other day trained with regular glycogen levels. After 10 weeks the LOW leg showed higher a increase of Citrate Synthase (CS) which is a marker of increased mitochondrial volume and HAD which shows greater oxidative capacity, compared to the HIGH. The LOW leg also performed better in a time to exhaustion test (TTE) compared to the HIGH.

This study was definitely a huge pain to go through and in most countries, it wouldn’t even get approved by ethics. Hence ecological validity isn’t particularly high but this was simply a “proof of principle” study that eventual lead to more studies being done. Another thing to take note of is that this study was done with untrained population and the effects on trained population might be different

To create a study that had greater real world application, a similarly study was done using a cycling model on 12 endurance trained cyclist or triathletes. Using a similar design in a cycling model, one group trained twice a day with both steady state (SS) and high intensity interval training (HIIT) done on the same day (LOW) every other day while the other group once a day, every day (HIGH) alternating between SS and HIIT for 3 weeks. Participants cycled for an initial 100 minute of SS cycling followed by 8 x 5 minutes of HIIT at 75-80% Pmax (Yeo et al., 2008).

The LOW group was given only water while the high group had no nutritional restriction. In the first two weeks, the LOW group had reduced power output compared to the HIGH but that stabilized in the third week. After 3 weeks, biopsies showed a higher increase in CS and β-HAD in the LOW in agreement to the results reported by Hansen et al. The LOW group also had 12473749_10156454930670440_2801202052687652102_ohigher lipid oxidation compared to the HIGH. A 60 minute time trial was also performed to measure performance improvement but there was no difference between groups. Unlike the study done by Hansen et al which showed an improvement in both mitochondrial adaptation and performance (TTE) Yeo et al couldn’t display an additional performance benefit despite enhance mitochondrial adaptation in the LOW group.

Hulston and colleagues (2010) performed what was almost a replication of the study conducted by Yeo et al with small changes in different training parameters and what they showed was consistent with the previous findings, as markers of mitochondrial adaptation (CS and β-HAD) and lipid oxidation increased while a drop in power output was seen in the low group and both groups showed similar improvement in a time trial test.

Despite the lack of performance improvement, most acute studies done would be in agreement with the chronic studies showing additional improvement in markers of mitochondrial adaptation (some acute studies did not show improvements but will be touched on below). Using a cycling model, Psilander and colleagues (2013) recruited 10 subjects to investigate the acute response to training with reduced glycogen availability on highly trained athletes. They performed exercise either in a high glycogen session or low glycogen session with at least a week in between sessions. On the first day, a protocol to deplete glycogen was done for both high and low sessions. The high session then consumed two high carbohydrates meal and returned for the exercise test 14 hours later, whereas the low session was commenced 14 hours later after consuming two low carbohydrate meal. The exercise test consist of 6 intervals of 10 minutes with 4 minutes of active rest in between intervals. The first interval started at 72.5% Vo2 max and subsequent intervals were reduced by 2.5% making the last interval 60% of Vo2 max. A muscle biopsy obtained 3 hours post test showed a greater increase in PGC-1α expression with also an increase of the mitochondrial enzyme pyruvate dehydrogenase lipoamine kinase isoenzyme 4 (PDK-4).keto-diets-suck

In a different study, increases of PDK- 4 and Carnitine palmitoyltransferase I (CPT-1), another mitochondrial enzyme was higher in the group that performed exercise in a lower glycogen state (Bartlett et al., 2013). 8 participants performed a glycogen depletion protocol in the evening lasting 68 minutes. Participants returned the next morning to perform High Intensity Training (HIT) running for 6 x 3 minutes at 90% Vo2 max. Participants exercised either in a high (HIGH) carbohydrate state or low (LOW) carbohydrate state. In the HIGH state, participants were fed carbohydrate before, during and after HIT while in the LOW state, no carbohydrate was fed before, during and after HIT. Participants switched groups (HIGH to LOW or LOW to HIGH) and repeated the protocol with a minimum of 7 days rest between protocols. Phosphorylation of p53 was also higher in LOW compared to HIGH but the increase of PGC-1α was similar between both groups.

So far every exercise protocol here has been done using an endurance exercise model, for all the meat heads out there, don’t lose hope as there is one study that used resistance training to investigate similar hypothesis.

Low carbohydrate availability and resistance exercise.

In this study, Camera and workers (2015) recruited participants to perform resistance exercise to investigate the acute response on mitochondrial adaptation. A group of 8 healthy fit males were recruited and they performed a glycogen depletion protocol on one leg. Participants then consumed a low carbohydrate dinner and returned the next morning to perform resistance exercise after an overnight fast to ensure one leg would perform the exercise in a low glycogen state. Participants then performed 8x 5 minutes at 80% of their 1RM with 3 minutes rest in

Check out Pauline's glycogen filled skeletal muscles.

Check out Pauline’s glycogen filled skeletal muscles.

between legs. The leg that performed resistance exercise in a low glycogen state had greater phosphorylation of p53 compared to the normal leg and PGC-1α also had a higher increase in the low glycogen leg.

As far as the acute and chronic changes in mitochondrial adaptation is concerned, it’s safe to say that training in a low glycogen/carbohydrate state definitely enhances this response. When it comes to performance, it’s not so clear cut.

Two other studies showed increases in both mitochondrial adaptations but when it came to the actual performance test, improvements were similar across both groups with no additional performance outcome (Morton et al., 2009, Van Proeyen et al., 2011).

Low carbohydrate availability and greater performance improvement.

However there are two studies that have been published recently that shows an improvement in performance. The first was done by Cochran and workers (2015) which showed that high intensity interval training (HIIT) performed twice a day with the second bout in a glycogen reduced state showed an improvement in a 250kj time trial compared the control group. This training protocol lasted 2 weeks. Another study was published early this year that showed that by simply altering the timing of intake of carbohydrate resulted in both a reduction in body fat and improved performance in a stimulated triathlon test (Marquetz et al., 2016).

In brief, both groups performed two bouts of exercise. The first bout of exercise took place in the evening and consisted of 8 x 5 minutes of maximum aerobic power followed by 60 minutes of cycling at 65% maximum aerobic power. The sleep low group restricted carbohydrate from their meals after the first bout of exercise up till the second bout of exercise whereas the Science rocks piccontrol group maintained carbohydrate availability with throughout the recovery period up till the second exercise bout and a carbohydrate drink was consumed during the second bout of exercise. After the second bout of exercise, the sleep low group then consumed large amount of carbohydrates to match the amount consumed by the control group. Both groups were given a protein drink before bed and total energy intake was matched between groups.

Improvements in triathlon simulated trial, decreased in heart rate and rate of perceived exertion took place only in the sleep low group whereas the control group showed no noticeable difference. This study is significant because it’s the first and only study that showed an improvement in performance in a group of highly trained athletes whereas the previous studies (Hansen et al and Cochran et al) was done in untrained individuals.

This is almost all the evidence there is on training with low carbohydrate availability and I hope that it has given some insight on the mechanism on how it works.

I’ve purposefully left out some evidence from the literature because I plan to include that in the next part where we will touch on the implementation of low carbohydrate availability training and how to optimise it to get a performance outcome.  Part 2 coming soon!

References

Alexander, A. and Walker, C. (2011). The role of LKB1 and AMPK in cellular responses to stress and damage. FEBS Letters, 585(7), pp.952-957.

Bartlett, J., Louhelainen, J., Iqbal, Z., Cochran, A., Gibala, M., Gregson, W., Close, G., Drust, B. and Morton, J. (2013). Reduced carbohydrate availability enhances exercise-induced p53 signaling in human skeletal muscle: implications for mitochondrial biogenesis. AJP: Regulatory, Integrative and Comparative Physiology, 304(6), pp.R450-R458.

Burke, L., Kiens, B. and Ivy, J. (2004). Carbohydrates and fat for training and recovery. Journal of Sports Sciences, 22(1), pp.15-30.

Camera, D., Hawley, J. and Coffey, V. (2015). Resistance exercise with low glycogen increases p53 phosphorylation and PGC-1α mRNA in skeletal muscle. European Journal of Applied Physiology, 115(6), pp.1185-1194.

Cochran, A., Myslik, F., MacInnis, M., Percival, M., Bishop, D., Tarnopolsky, M. and Gibala, M. (2015). Manipulating Carbohydrate Availability Between Twice-Daily Sessions of High-Intensity Interval Training Over 2 Weeks Improves Time-Trial Performance. IJSNEM, 25(5), pp.463-470.

Hansen, A., Fischer, C., Plomgaard, P., Andersen, J., Saltin, B. and Pedersen, B. (2005). Skeletal muscle adaptation: training twice every second day versus training once daily. Scand J Med Sci Sports, 15(1), pp.65-66.

Hulston, C., Venables, M., Mann, C., Martin, C., Philip, A., Baar, K. and Jeukendrup, A. (2010). Training with Low Muscle Glycogen Enhances Fat Metabolism in Well-Trained Cyclists. Medicine & Science in Sports & Exercise, 42(11), pp.2046-2055.

Leckey, J., Burke, L., Morton, J. and Hawley, J. (2015). Altering fatty acid availability does not impair prolonged, continuous running to fatigue: evidence for carbohydrate dependence. Journal of Applied Physiology, 120(2), pp.107-113.

Marquet, L., Brisswalter, J., Louis, J., Tiollier, E., Burke, L., Hawley, J. and Hausswirth, C. (2016). Enhanced Endurance Performance by Periodization of CHO Intake. Medicine & Science in Sports & Exercise, p.1.

Morton, J., Croft, L., Bartlett, J., MacLaren, D., Reilly, T., Evans, L., McArdle, A. and Drust, B. (2009). Reduced carbohydrate availability does not modulate training-induced heat shock protein adaptations but does upregulate oxidative enzyme activity in human skeletal muscle. Journal of Applied Physiology, 106(5), pp.1513-1521

Psilander, N., Frank, P., Flockhart, M. and Sahlin, K. (2012). Exercise with low glycogen increases PGC-1α gene expression in human skeletal muscle. European Journal of Applied Physiology, 113(4), pp.951-963.

Saltin, B. (1973). Metabolic fundamentals in exercise. Medicine & Science in Sports & Exercise, 5(3), pp.137-146.

Torrens, S., Areta, J., Parr, E. and Hawley, J. (2016). Carbohydrate dependence during prolonged simulated cycling time trials. European Journal of Applied Physiology.

Van Proeyen, K., Szlufcik, K., Nielens, H., Ramaekers, M. and Hespel, P. (2010). Beneficial metabolic adaptations due to endurance exercise training in the fasted state. Journal of Applied Physiology, 110(1), pp.236-245.

Yeo, W., Paton, C., Garnham, A., Burke, L., Carey, A. and Hawley, J. (2008). Skeletal muscle adaptation and performance responses to once a day versus twice every second day endurance training regimens. Journal of Applied Physiology, 105(5), pp.1462-1470.

About the Author: Kedric Kwan CISSN

Kedric is a performance nutritionist (CISNN) certified through the International society of sports nutriKedric Kwantion (ISSN) and is currently pursuing his MSc. His researc
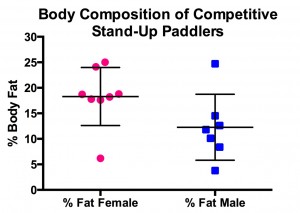
h is currently focusing on
carbohydrate and it’s effect on sports performance with a particular interest in the molecular signalling pathways. He has worked with professional football players, powerlifters and endurance athletes but his current clientele consist of strength/power athletes and the general weekend warrior. His aim is to able to translate the ABC soup of complex science into something palatable for the general population. He is also a competitive powerlifter and when he is not spending time nerding over science or lifting heavy weights, he enjoys indulging in ice cream and reading about superheroes. If you enjoy any of the aforementioned things, feel free to drop him a holla!

WhasSUP

12593627_10156454963675440_7871695030623706850_oby Jose Antonio PhD. “Watchin’ the game, havin’ a Bud.” One of my favorite commercials of all time is the Budweiser Original Whassup Commercial. Every time I see the acronym ‘SUP,’ it reminds me of that commercial. For old time’s sake, check it out! 

WhasSUP is SUP! Did you know that guys and girls who regularly train by doing stand-up paddling are overall, pretty darn lean. Yep, you read that right. One morning as a was sipping on my 2nd cup of caffeine-filled coffee (anyone who drinks decaf is as un-American as the ‘hammer and sickle”), I decided to massage a few numbers to see what the “typical” body composition was of seven male and eight female competitive SUP athletes that my research team at Nova Southeastern University have had the privilege of testing. Check out the figure below with pink circles and blue squares. It may look sciencey and all, but it’s actually fairly simple. If you stayed awake in your college statistics class, you’ll decipher that data faster than you can shake a Polaroid picture. So what’s the scoop? First of all, each pink circle or blue square represents an individual female or male SUP athlete’s percent body fat. If you look at the y or vertical axis, you’ll see the scale starting from 0% fat (which only exists on the X-Files) going up to 30% fat (which you’ll find is on the high end in female athletes in general).

Body Composition of SUP peeps

On average, female SUP athletes are about 18.3% body fat. Male SUP athletes are about 12.3% body fat. These percent body fats were obtained via air displacement plethysmography (aka the Bod Pod). One should note that the Bod Pod often overestimates % body fat in lean individuals. But what the Bod Pod is very good at is determining whether body composition changes (i.e., changes in fat mass and/or fat-free mass).

Nonetheless, averages only tell part of the story. You’ll also notice in the figure that there is quite a ‘spread’ of the data (i.e., standard deviation). You even have male and female SUP athletes in the single digits. Holy low-body-fat Batman! That’s like leaving a tooth under your pillow and finding a gold nugget the next day. Ok, maybe not. But it’s pretty intriguing. Obviously there are the lucky few who hit the genetic lottery and train like maniacs. It is extremely difficult for any athlete to hit the single digits and stay there. It’s as rare as seeing Bigfoot at Yellowstone National Park. On the flip side, you also have male and female SUP athletes exceeding 20% body fat. If you compare that to the average SUP’er it does seem ‘high.’ But in reality it falls within the range of where college athletes are. Let’s now go to figures below (red bar graph and blue bar graph).

I decided to look up some of the published scientific data on body composition in male and female college athletes. Keep in mind that the SUP athletes I’ve measured are typically older (> 30 years of age). And yet, at least for female SUP’ers, they are leaner than college-age basketball, softball and crew athletes.Slide1 Slide2

And for the guys, they are as lean as athletes in traditional sports like football, hockey and basketball. So clearly, all you young (and old) SUP’ers have a good thing going. SUP is a sport that can be best described as a ‘power-endurance’ sport. It also requires a high aerobic capacity as exemplified by the fairly high V02max data I’ve collected. However, you also need to generate power over many many miles. So it’s a bit of a ‘hybrid’ in the sense that it is not a pure ‘cardiovascular’ sport (i.e., it is not all about cardiac output). Instead, you still need to develop a high level of skeletal muscle power/endurance.

So before your eyes start to roll back because you’ve seen more data in this article than that dreaded stats or math class, I want to leave you a few key pieces of advice that SUP’ers and all athletes should follow if they want to perform better.

A few quick tips

  1. Haphazard training produces haphazard results. Have a plan. Stick to it. Train in a systematic fashion. Stay tuned for some super-cool data on training. What’s the correct mix of volume training versus HIIT?
  2. Remaining injury-free is critically important. Some might say this should be your paramount goal. In fact, performance success or failure is often influenced by rates of injury. (Reference: @YLMSportsScience)
  3. Dial in your nutrition. This is perhaps more difficult than training. Get plenty of protein and fat (the two most important macronutrients) and sufficient carbohydrate. There’s no need to ever ‘carb-load’ in this sport. (Nutrition can be its own article; maybe when my brain is more caffeinated, I’ll write that one).12493716_10156454958955440_4772152454592054761_o
  4. Sleep at least 8 hours a day. Athletes who sleep on average less than 8 hours per night have a 1.7 times greater risk of being injured. Yeah, that’s right. (Reference: @YLMSportsScience)
  5. Body composition is just one aspect out of many that are important for optimal performance. In general, having a certain amount of lean body mass is important for excelling at SUP.
  6. Each training session should serve a purpose. Avoid ‘junk miles.’
  7. Even if you’ve been dealt the not-so-good end of the genetic lottery, you can still improve. It just depends how badly you want it.

ALOHA – THE END.

Geek Reading That You’ll Probably Never Read – Unless at Gunpoint – JJ Ode et al. Body Mass Index as a Predictor of Percent Fat in College Athletes and NonAthletes. Medicine and Science in Sports and Exercise. 39(3):403-409, 2007.

About the author:  Jose Antonio earned his PhD at the University of Texas Southwestern Medical Center. He is a professor at Nova Southeastern University in Davie FL and the CEO of the International Society of Sports Nutrition. He enjoys junk food as much as the fat kids at the Texas State Fair. He’s been doing research on sports nutrition and human performance for nearly 3 decades. Somehow he’s managed to publish a dozen books and more scientific papers than there are states in the Union. And that’s between beach time and watching sports. Check out the International Society of Sports Nutrition’s conferences. There are more super-cool geeks (now that’s oxymoronic) here than there are Chins in a Chinese phonebook.

DCIM100GOPRO

Key micronutrients for building muscle

Livia Ly

By Livia Ly MS RD LDN. You are a weight trainer and you eat adequate amounts of carbs, protein and fat. You also take supplements, sleep well, rest enough, train hard, and change your training periodically. But still, it seems like you’ve hit a plateau trying to build more muscle. There could be multiple reasons for this, but one that I’m particularly interested in is a deficiency of micronutrients. There is no point in having a high calorie / protein diet if your body is lacking key nutrients that are crucial for specific reactions to form extra muscle cells. Some of these nutrients are needed for amino acid metabolism, others are indirectly related because they increase insulin sensitivity, which promotes muscle building through a pathway called the mTOR Signaling Pathway. Ok, enough of the geeky stuff, let’s take a look at a list of vitamins and minerals to take into consideration and check for possible deficiencies, so you can have meal plans created by your dietitian that are right for you.supplements (1)

  1. B-complex vitamins: physiologically speaking, vitamins B2, B6, and folate are all associated with the amino acid metabolism and transamination.

Rich food sources of B vitamins: beans, dark green leafy vegetables, all meats, cruciferous vegetables, tempeh, yogurt, crimini mushrooms, sweet potato, bell peppers, beets, parsley, sea vegetables, banana, sunflower seeds.

  1. Chromium: it has been suggested that chromium not only increases insulin sensitivity but also protects against muscle atrophy by preventing muscle degradationB.

Rich food sources of chromium: brewer’s yeast, beef, wheat and barley, mussel, shrimp and oyster, Brazil nut, dried dates, pear, tomato, mushroom, broccoli.

  1. Vitamin D: it is also recommended to adjust deficiency of vitamin D, considering its crucial role in the skeletal muscle, as vitamin D deficiency may promote insulin resistanceC,D.

Rich food sources of vitamin D: salmon, sardines, cow’s milk, tuna, eggs, and shiitake mushrooms.

  1. Magnesium: as the fourth most abundant element in the body and involved in hundreds of enzymatic reactions, magnesium also play a role in protein synthesisA.

Rich food sources of magnesium: magnesium is part of chlorophyll, thus plants contain high amounts of it. Dark green leafy vegetables, seeds, and beans are great sources.

  1. Zinc: the relationship between this mineral and protein synthesis is similar to that of chromium. Zinc may participate on the insulin signaling and proliferation of muscle cellsE.

Rich food sources of zinc: red meat, spinach, asparagus, shiitake and crimini mushrooms, seeds, and beans.

  1. Iodine: makes thyroid hormones and these hormones promote protein synthesis. So, iodine is directly related to muscle building as well.

Rich food sources of iodine: sea vegetables, scallops, cod, yogurt, and shrimp.

There you have it. A balanced, nutritious, adequate and complete diet plan is crucial for your goal of muscle building. If possible, talk to your doctor and ask him or her to check your health by measuring your vitamin D, or checking your thyroid health, for example.

References

A) de Baaij JH, Hoenderop JG, Bindels RJ. Magnesium in man: implications for health and disease. Physiol Rev. 2015;95(1):1-46.

B) Dong F et al. Chromium supplement inhibits skeletal muscle atrophy in hindlimb-suspended mice. J Nutr Biochem. 2009;20(12):992-9.

C) Garcia LA et al. 1,25(OH)(2)vitamin D(3) enhances myogenic differentiation by modulating the expression of key angiogenic growth factors and angiogenic inhibitors in C(2)C(12) skeletal muscle cells. J Steroid Biochem Mol Biol. 2013;133:1-11.

D) Girgis CM et al. Effects of vitamin D in skeletal muscle: falls, strength, athletic performance and insulin sensitivity. Clin Endocrinol (Oxf). 2014;80(2):169-81.

E) Ohashi K et al. Zinc promotes proliferation and activation of myogenic cells via the PI3K/Akt and ERK signaling cascade. Exp Cell Res. 2015;333(2):228-37.

BIO – Check out my site at http://www.nutri.ly/

Livia Ly


5 Annoying and Dangerous Myths About Protein


by Jose Antonio PhD FNSCA FISSN CSCS. After reading this blog (5 Annoying and Dangerous Things that Happen When You Eat Way Too Much Protein) on EatClean.com (http://www.eatclean.com/scoops/eat-too-much-protein), it reminded me of my undergraduate education as a biology major at The American University (AU) in Washington D.C.  Did you know that AU is the only university that was chartered by an act of Congress in the late 1800s? Enough of the useless trivia.  Anyhow. I took a nutrition course at AU whereby my nutrition professor proclaimed that ‘eating too much protein is bad for your kidneys.’ I thought that’s odd. I looked in the book for references and alas, none were to be found. And if you look in other books, you’ll see the same statement yet again with no randomized controlled trials (RCTs) to support it. Let’s fast-forward to this journalist piece of silliness published on eatCLEAN.com. Perhaps the only thing that is annoying is how devoid this article is of scientific evidence. And as far as danger, well your nutritional IQ might drop 25 points if you actually believe the cow poop in this piece.  The author lists these five things as the terrible 5:  1) Your breath smells funky. 2) Your mood takes a dive. 3) You might wreck your kidneys (egads this again!). 4) You’re plagued with GI issues. 5) You gain weight.

As far aWoman brushing her teeths #1, I’d suggest brushing your teeth and using Scope. If you prefer ‘medicine-like’ breath, Listerine works quite fine. I guess the author would probably tell you to stay away from garlic and onions too. And the author makes the cardinal error of associating high protein diets with low carb consumption. There is absolutely no reason why the two even have to go
together.

06062011_Pauline-420

Pauline eats more protein than a family of four in the Philippines.

As far as #2, you know what puts you in a bad mood? Reading that article. Again, this author commits the cardinal sin of equating a high protein diet with one that is low in carbs. In fact, to quote from her stellar piece of writing: “Your brain needs carbs in all their sugary, starchy glory to stimulate the production of the mood-regulating hormone serotonin. Strip them from your diet, and you’re more likely to feel grouchy, irritable, or just blah.” Did she use the word ‘carbs’ in that sentence?  Ok, that’s what I thought. Either way, a study published in PLoS One found that “Consumption of the high-protein vs. high-carbohydrate meal did not affect feelings of depression, tension, anger, anxiety.”[1] Issues related to mood are so complex that to assign ‘bad mood’ to eating insufficient carbs or too much protein is nonsensical. Heck, one of my teenage daughters changes her mood faster than the speed of an action potential.

#3. Oh boy. Where do we start with this piece of journalistic absurdity? After scouring the literature for over 40 years, there is no evidence that eating a high protein diet has any detrimental effects on renal function in otherwise healthy individuals. To wit:

  • “In healthy obese individuals, a low-carbohydrate high-protein weight-loss diet over 2 years was not associated with noticeably harmful effects on GFR, albuminuria, or fluid and electrolyte balance compared with a low-fat diet.”[2]
  • “To conclude, it appears that protein intake under 2. 8 g.kg does not impair renal function in well-trained athletes as indicated by the measures of renal function used in this study.”[3]

In fact, I just finished collecting preliminary data on high protein diets in which subjects consumed on average 3 g/kg/d of protein for a period of 4 months. This data is hot of the press, so if you’re reading this now, you’re privy to some super-cool science. You’ll notice (see the Table below) that not a g-damn thing changes. One of my subjects exceeds 6 grams per kg Dymatize-Iso-100daily. I think he eats a chicken a day. Ok, not really. But that’s a bucket of protein. And his renal function is normal. This harkens back to half a century ago when doctors believed that exercise was bad for the heart. Why? Because it ‘overworked’ the heart. Now that’s some funny shit. I keep hearing this refrain about renal function and protein. “What’s your body gonna do with all that urea (from protein degradation)?” The answer: your kidneys eliminate it.  That’s their frickin’ job for chrissakes. Urea is also eliminated via the sweat glands. So using the sterling logic of so many who are uniformed, does that mean that your sweat glands are harmed because they have to ‘work’ so hard in eliminating urea? Puuullllleeeeassssse.  (Note: the final data for the study mentioned in my lab will likely be published in the 1Q2016).

High Protein Intakes in Resistance-Trained Men – Comprehensive Metabolic Panel


Baseline

High

Protein

Reference

Range

Glucose mg/dL

84±12

85±19

65-99

BUN mg/dL

21±5

23±5

7-25

Creatinine mg/dL

1.1±0.2

1.1±0.2

0.60-1.35

GFR ml/min/1.73m2

97±21

99±17

§

BUN/Creatinine ratio

19.3±5.7

21.0±2.2

6-22

Sodium mmol/L

139±2

138±1

135-146

Potassium mmol/L

4.3±0.4

4.3±0.2

3.5-5.3

Chloride mmol/L

103±2

102±3

98-110

Carbon Dioxide mmol/L

27±2

27±2

19-30

Calcium mg/dl

9.7±0.2

9.7±0.3

8.6-10.3

Total Protein g/dL

7.1±0.3

7.1±0.4

6.1-8.1

Albumin g/dL

4.7±0.2

4.6±0.2

3.6-5.1

Globulin g/dL

2.5±0.2

2.5±0.3

1.9-3.7

Albumin/Globulin ratio

1.9±0.2

1.9±0.2

1.0-2.5

Total Bilirubin mg/dL

0.6±0.3

0.8±0.3

0.2-1.2

Alkaline Phosphatase U/L

68±14

68±12

40-115

AST U/L

27±9

27±6

10-40

ALT U/L

28±19

28±10

9-46

Data are mean±SD.  n=11 Legend:  ALT – alanine transaminase; AST – aspartate transaminase; BUN – blood urea nitrogen; GFR – glomerular filtration rate (§ normal values: ≥60 ml/min/1.73m2).  There were no differences between any of the groups.

#4 This article has enough straw(men) to fill a barn in Iowa. Again, the author makes the egregious error of equating high protein diets with those low in fiber.  WTF. Here’s a piece of advice. For every piece of that juicy steak you consume, take a bite of broccoli. There is nothing difficult about eating a high protein diet and one that also has plenty of fiber. I have plenty of friends who can accomplish this seemingly impossible task. Try riding to the top floor of Sears Tower (now known as the Willis Tower) in Chicago with these fiber-loving, protein-eating peeps!Straw-Man-Fallacy-e1347740267364-600x350

#5 You gain weight. No shit. If you lift weights and eat a bucketful of protein, you will likely gain lean body mass. But here’s the kicker. If all you did was overeat on protein (i.e., in our study subjects overfed on whey protein), you would likely lose weight. And not muscle mass my friend. You’d lose fat. In a study we presented at the 2015 ISSN Conference in Austin TX, we found that individuals who had the highest protein intakes (>3 grams per kg b.w. daily), also experienced a significant drop in % body fat. The NP (normal protein) group consumed a little over 2 grams per kg b.w. daily. And even that group lost a little bit of fat.

We even have data that if you just ate a LOT of protein (> 4 grams per kg b.w. daily) for 2 months (with no change in training), your body weight or body fat levels don’t even change.[4] Translation: it is extremely difficult to put on body fat by the mere overconsumption of dietary protein alone.

So what’s the moral of the story?  Eat protein. Eat plenty of it. It’ll help you recover; it’ll improve body composition; and besides, sometimes you just need to eat a thick juicy steak.

high-protein-diet

BIO – Dr. Jose Antonio is the CEO of the ISSN (www.issn.net) and an Assistant Professor at Nova Southeastern University. His current research focus is on the effects of high protein diets on recreational bodybuilders and SUP (stand up paddlers). He probably eats more white rice than protein.

References

1.         Lemmens SG, Born JM, Martens EA, Martens MJ, Westerterp-Plantenga MS: Influence of consumption of a high-protein vs. high-carbohydrate meal on the physiological cortisol and psychological mood response in men and women. PLoS One 2011, 6:e16826.

2.         Friedman AN, Ogden LG, Foster GD, Klein S, Stein R, Miller B, Hill JO, Brill C, Bailer B, Rosenbaum DR, Wyatt HR: Comparative effects of low-carbohydrate high-protein versus low-fat diets on the kidney. Clin J Am Soc Nephrol 2012, 7:1103-1111.

3.         Poortmans JR, Dellalieux O: Do regular high protein diets have potential health risks on kidney function in athletes? Int J Sport Nutr Exerc Metab 2000, 10:28-38.

4.         Antonio J, Peacock CA, Ellerbroek A, Fromhoff B, Silver T: The effects of consuming a high protein diet (4.4 g/kg/d) on body composition in resistance-trained individuals. J Int Soc Sports Nutr 2014, 11:19.


Fixing Your Gut – 5 Steps


by Livia Ly, MS, RD, LDN. Dietitian | Nutritionist • Owner. Nutrily, LLC |

How have you been getting along with your gut bacteria lately? Hopefully pretty well, as you have trillions of them living in your gut and they are responsible for your immunity, metabolism, and brain health! And this list keeps increasing with more research being published.Good-Gut-Feeling

Most of the studies though, are associational, but there is evidence that your gut bacteria is dictating the direction your health is taking. The composition of your gut bacteria is determined by some factors that cannot be changed, like age, gender, region of origin6,11, birthing method (C-section vs. vaginal delivery)10 and first foods (breast milk vs. formula)10. But other factors also influence your gut bacteria composition and can be changed such as:

  • Pollutants in your environment13
  • An unhealthy diet22
  • Lack of exercise or training overload with no appropriate recovery14,18
  • Use of laxatives and antibiotics19,26
  • Poor chewing12
  • Changes in salivary, stomach and intestinal pH and weakened immunity8
  • Frequent consumption of food dyes and preservatives11
  • Low intake of water15

Remember, your healthy gut bacteria has to be replenished every day. Your small intestine is large, I mean it’s larger than a tennis court! And it is the gateway of nutrients that will be distributed throughout your body. All the varieties of healthy bacteria participate in digestion, absorption, formation of short-chain fatty acids from fiber, formation of vitamins B3, B5, B6, B12, folate, biotin, and vitamin K, cholesterol reduction, toxin and pathogen elimination, and hormone formation (including brain and satiety hormones). From fermentation, bacteria can produce anti-inflammatory  components and the gut immune system is made up of specialized immune cells that produce antibodies3,17,19,20 Gut bacteria also produce conjugated linoleic acid, a potent anti-cancer and anti-obesity component2. Yes, they are busy!

But your gut bacteria can be the unhealthy variety and make you sick. When the gut wall is irritated or inflamed, the tight junctions between your gut cells loosen up and you get increased permeability. Then you may get unpleasant symptoms like:

  • Constipation and / or gas1,
  • Brain related symptoms. Your brain and gut are connected through the hormonal (cortisol), immune (cytokines) and neural (vagus and enteric nervous system) pathways5:
  • depression, insomnia (tryptophan which would be converted into serotonin, the hormone of well-being, and melatonin, will be converted by pathogenic bacteria in other toxic substances)5,7,25,
  • memory loss (inflammation favors the death of neurons)5,
  • stress (lack of bacteria which are capable of controlling the levels of cortisol)5,
  • Increased urge for sweets (stimulated by the lack of serotonin and other nutrients that had their absorption compromised)16
  • Weight gain (due to increased inflammation and decreased serotonin levels. In addition, gut bacteria affects the amount of energy taken from your diet and consequently helps increase the storage of fats; it also regulates genes related to obesity)22; or weight loss (due to malabsorption).
  • Developed metabolic disorders, such as insulin resistance22
  • Increases in cholesterol (due to the toxicity that is generated, favoring an increase in endogenous cholesterol, which is produced by your body)17,
  • Poor immunity and increased inflammation and allergenic reactions: such as migraines, rhinitis, sinusitis, arthritis, cellulitis, among others21,
  • Urinary tract infections21,
  • Fungal infections like candidiasis21 or ringworm23,
  • Acne or skin irritation9,
  • Gastritis by H. pylori bacteria4,
  • Symptoms related to lack of vitamins and minerals (due to malabsorption) like anxiety, hair loss, nail weakness, osteoporosis, and anemia among many others.

I am a dietitian and I talk a lot about poop! What does your poop look like on an average day? Your answer will say a lot about your health. Going to the bathroom every day is not a sign of a proper healthy bowel. Your daily stool should be brown, smooth with no cracks, whole, without food debris, mucus or blood. You should not have difficulty eliminating it. Healthy feces are so important that people have been doing feces transplantations to fight infections, inflammation, or chronic diarrhea here in the U.S.24 Isn’t that insane? Hopefully you are taking this seriously by now, your gut bacteria is the boss of your body. But even if you go to the bathroom every day, you may still have the above symptoms that are related to poor gut bacteria.

If you want to lose fat, gain muscle, improve your sports performance, and boost your health and your mood, you will first need to take care of your gut bacteria. I recommend that you take these 5 steps to address all of your problems by fixing your gut:

STEP 1) Eat plenty of prebiotics and probiotics

Some non-digestible carbohydrate substances reach your gut and are metabolized to promote the growth of healthy gut bacteria, these substances are called prebiotics and are found in foods rich in fiber like inulin found in endive, asparagus, leek, onions, garlic, green banana (check out my recipe to make a green banana biomass here), wheat, artichoke, and herbs and fructo-oligosaccharides, found in onion, garlic, tomato, green banana, oats, barley, wheat, and honey.prebioticsandprobiotics

The gut bacteria use these prebiotics as foods while promoting fermentation and producing lactic acid, short chain fatty acids and gas, which leads to a reduction of intestinal pH and stimulates growth of healthy gut cells.

A recent study, double-blinded RCT, published and led by Dr. Kelly Swanson at the Journal of Nutrition this month, investigated that the agave plant inulin differs from other inulin type fibers, and the researchers suggested that these differences affect bacterial use and health results. There were 29 healthy adults in the study and they took 0, 5, or 7.5 g/day of agave inulin for three weeks (three-period, crossover trial for 21 days with seven days washouts between periods). Stools were collected and examined and it was found that Bifidobacterium (healthy gut bacteria) levels increased three or four­fold after 5 and 7.5 grams/day, respectively, of agave inulin supplementation. Cool! I asked Dr. Swanson why we should choose agave over other inulin sources, and this is what he said:

“Because animal studies had reported lower body weight, fat mass %, and blood lipids (triglycerides; cholesterol) and glucose concentrations in rodents fed agave inulin compared to those fed other inulin sources, we were interested in its response in humans. In general, I think all forms of inulin have the potential for improved gastrointestinal health. Given the structure and degree of polymerization of agave inulin and our tolerance data, however, it appears that the agave source is fermented at a slower rate than the linear forms and may be tolerated at a higher dose. Translating these data to consumers, it appears that the benefits of agave inulin on gut microbiota and other gastrointestinal health measures may be obtained with fewer side effects (e.g., flatulence and gastrointestinal discomfort).”

You can buy agave inulin powder here and try it out for yourself.

There is also another class of substances, called probiotics that contain live bacteria (such as Lactobacillus and Bifidobacterium) that produce beneficial effects, favoring the gut.

Another double-blinded RCT study published in 2012 at the amazing Journal of the International Society of Sports Nutrition demonstrated that probiotic supplementation improves intestinal barrier function and reduces inflammation in trained male endurance athletes. This means probiotics protect the integrity of your gut wall. If you decide to try a supplement, choose one that contains a variety of strains and at least 1 billion or more active cells, but to avoid imbalance don’t overuse it. If you prefer to stay on the safe side, stick to fermented foods like fermented milk (e.g. Yakult), yogurt (e.g. Kalona SuperNatural™), kefir and kombucha (e.g. Cultures for Health), sauerkraut, kimchi, and sourdough bread, miso, tempeh are all good sources of various strains of bacteria.

Other types of fiber also help your gut work better. Insoluble fiber found in whole grains, wheat germ, seeds, nuts, beans, fruits (dried plums, raspberries, apples, strawberries, grapes, and raisins), and vegetables (zucchini, celery, broccoli, cabbage, onions, tomatoes, carrots, cucumbers, dark leafy vegetables, and root vegetable skins) improve regularity reducing our exposure to potentially dangerous compounds. The breakdown of fiber also regulates pH balance promoting the optimal environment for beneficial bacteria.

STEP 2) Other foods I think you need to consider

Turmeric is a powerful anti-inflammatory food that you must include in your cooking (add black pepper to absorb turmeric better).

Add omega 3 fatty acids (salmon, tuna, sardines, flaxseeds, walnuts, and algae) and other healthy fats (olives, avocado, coconut, nuts, seeds, and cacao) to help decrease inflammation.

Other anti-inflammatory foods are tart cherries, apple peels and almonds.

Consider flavonoids to improve gut health with their powerful antioxidant content.

Flavonols flavan-3-ols* flavones flavonones anthocyanidins
Onions apples parsley oranges blueberries
Apples bananas bell peppers grapefruit bananas
romaine lettuce blueberries celery lemons strawberries
Tomatoes peaches apples tomatoes cherries
garbanzo beans pears oranges pears
Almonds strawberries watermelon cabbage
turnip greens chili peppers cranberries
sweet potatoes cantaloupe plums
Quinoa lettuce raspberries
garbanzo beans

Source: WHFoods

STEP 3) Supplement wisely

Check to see if you are not vitamin D or iron deficient, as their insufficient levels are related to poor gut function and consequent malabsorption of other nutrients. If you are an endurance athlete, you should be especially concerned about your iron level.

Consider glutamine because it improves gut functioning and help reverse excessive gut permeability.

You may also need to take digestive enzymes. Check this with your doctor

STEP 4) Foods that you may need to eliminate

Maybe it’s not the food that you are not eating enough of that is causing your symptoms, but the foods that you are eating. Common offenders are:

  • Lectins: a type of protein found in grains, beans, and nuts,
  • Gluten from wheat, hordein in barley, secalin in rye, or zein in corn,
  • Casein, lactose, and other immunoglobulins in dairy,
  • Fructose,
  • Sugar alcohols,
  • Added sugars in foods,
  • Refined grains (as they stimulate the growth of fungi, yeasts and harmful bacteria in the intestine),
  • MSG,
  • Alcohol,
  • Processed foods high in saturated fats,
  • Industrialized juices and sodas.

You may try an elimination diet or a diet called FODMAP with your dietitian (hopefully me!). You may also try to reduce your chemical consumption if you buy organic foods when possible, avoid heating foods in plastics, and avoid fish high in mercury (tilefish, king mackerel, swordfish, albacore tuna, and shark).

STEP 5) Change your lifestyle

Get to the root cause. While there can be many causes of gut problems, there is always a cause and promoting an overall healthy lifestyle can help.

  • Quit smoking,
  • Manage your stress and anxiety level,
  • Go to the bathroom at the same time every day,
  • Exercise,
  • Drink more water to promote healthy poop,
  • Eat slowly. The process of slow chewing is important for enzyme release to break down food into particles that are manageable for the gut to absorb,
  • Stop eating when satisfied to avoid overconsumption of sugars, processed grains, processed meats, and dairy,
  • Sleep well,
  • Recover well after strenuous exercise. High training loads creates a chronic stress from which the body struggles to recover and produces inflammation,
  • Avoid liquids with your meals as it affects your stomach by diluting the gastric juices, causing the food to reach the intestine undigested.  This undigested food may cause allergies and malabsorption,
  • Eat spices like rosemary, ginger, garlic, and cinnamon to avoid the overgrowth of fungi that increases infections.

There you have it, five steps to promote a powerful healthy gut bacteria that will keep you healthy and feeling great!

 References

Bazzocchi G et al_Page_3 Bazzocchi G et al_Page_1


Cardio Lowers RMR – A Fairy Tale


by Jose Antonio PhD FNSCA FISSN. Today’s story is entitled “Cardio lowers RMR – A Fairy Tale.”

Key Points to Remember

  • There is a plethora of scientific evidence, which demonstrates that regular aerobic training has no effect on RMR. Some studies actually find an increase.
  • Resting energy expenditure is largely a function of body weight and FFM.[1, 2]
  • Cardio has become the “carbs of the fitness world.” – Shawn Arent PhD, Rutgers University
  • If you like doing cardio, don’t let some fitness guru talk you out of it.
  • If you hate doing cardio, then for Pete’s sake, don’t bitch about those who do it.
  • If you want to elevate your RMR, gain weight, especially skeletal muscle weight (note: for every 1 pound of LBM you gain, your RMR may go up ~10 kcal; so do the math. You’ll need to gain a helluva lot of weight).
  • RMR is by itself a meaningless measure for the performance sports.
  • If you compete in football, baseball, basketball, cycling, volleyball, rowing, surfing, paddling, gymnastics, soccer, hockey, track and field (pick one) or frickin’ tiddlywinks, measuring RMR is about as useful as selling bikinis to Russian women in Siberia.

Social Media Silliness

So what is it about aerobic training (i.e., ‘cardio’) that has gotten the ire of so many fitness professionals? Cardio makes you fat? Yep. And there really is a pot of gold at the end of the rainbow. For my take on the ’cardio makes you fat’ baloney, read this piece from the ISSN Scoop: http://www.theissnscoop.com/cardio-makes-you-fat-and-apples-will-rise/

Supposedly cardio, especially the lower intensity variety, will lower your resting metabolic rate Beach walking(RMR) faster than a New Yorker can flip you the birdie. So I guess if you go for a walk on the beach after pigging out on beer and chicken wings, your metabolic rate will magically drop?

Let’s say you and your significant other visited the Sunshine State (that’s Florida for those who flunked 7th grade geography). Every morning for a week, you walk hand-in-hand up and down the beach. Sometimes you’d walk for more than an hour. Would your RMR drop because of this dreaded low intensity cardio? Are all these beach walkers killing their RMR? To quote the former #1 tennis player and part-time brat on the court John McEnroe, “You can NOT be serious!”

johnnymac_zps31f826d7Easy enough. So what does the science say on cardio and RMR? Below are a series of abstracts that I’ve shortened and added my pithy comments. It’ll give you a snapshot of the literature as it relates to exercise training and RMR. I’ve highlighted the parts that are of interest to those of you with the attention span of a mosquito.

Study #1 – This study examined resting metabolic rate (RMR) and thermic effect of a meal (TEM) among athletes who had participated in long-term anaerobic or aerobic exercise. Nine collegiate wrestlers were matched for age, weight, and fat-free weight with 9 collegiate swimmers. RMR adjusted for fat-free weight was not significantly different between groups. Thus, it doesn’t matter if you engage in long-term aerobic and anaerobic exercise training; resting energy expenditure is not different between these college athletes.[3] So whether you want to swim in chlorinated water or wrestle someone who smells like dirty socks soaked in vinegar, it don’t matter. RMR won’t be adversely affected.

Study #2 – Eight moderately obese women took part in an 11-week training program, including 5 hours of aerobic exercise per week performed at a mean intensity of about 50 percent VO2 max. Now that my friends is frickin’ low intensity. Fifty percent max VO2 is like a walk in the park. So what happened? Oddly enough, the results showed that exercise-training induced a significant rise in RMR. In fact, this study showed an elevated RMR per unit of fat free mass in both lean and moderately obese individuals.[4]running

Study #3 – Thirty-one women (mean age 35 yr) who were overweight were matched and randomly placed into a control group (CON), a diet-only group (D), a diet+aerobic endurance exercise training group (DE), or a diet+aerobic endurance exercise training+strength training group (DES). Can you keep track of that? That’s a lot of groups. So after 12 weeks, the three dietary groups demonstrated a significant loss in body mass, % body fat, and fat mass. No differences were observed in the magnitude of loss among groups, in fat-free mass, or in resting metabolic rate.[5] So even though aerobic training plus diet resulted in a loss of weight and fat mass, there was no change in RMR. Hmmm.

Study #4 – The effects of either 12-wk of high-intensity endurance or resistance training on resting metabolic rate (RMR) were investigated in 47 males aged 18-35 years. Subjects were randomly assigned to either a control (C), resistance-trained (RT) or endurance-trained (ET) group. After training both exercise groups showed significant declines in relative body fat either by reducing their total fat weight and maintaining fat-free weight (ET) or by reducing their total fat weight and increasing fat-free weight (RT). RMR did not significantly change after either training regimen. These results suggest that both endurance and resistance training may help to prevent an attenuation in RMR normally observed during extended periods of negative energy balance (energy intake less than expenditure) by either preserving or increasing a person’s fat-free weight.[6]

Study #5 – Investigators determined the effects of aerobic exercise training and resistance exercise training and the incremental effect of combined aerobic and resistance exercise training on resting metabolic rate (RMR) in previously sedentary individuals with type 2 Cycling_20-2diabetes. One hundred and three participants were randomly assigned to four groups for 22 weeks: aerobic training, resistance training, combined aerobic and resistance exercise training, or waiting-list control. Exercise training was performed three times per week at community-based gym facilities. RMR did not change significantly in any group after accounting for multiple comparisons despite significant improvements in peak oxygen consumption and muscular strength in the exercising groups. Adjusting RMR for age, sex, fat mass, and fat-free mass in various combinations did not alter these results. These results suggest that RMR was not significantly changed after a 6-month exercise program, regardless of modality, in this sample of adults with type 2 diabetes.[7] Geez. Is there a pattern here? Isn’t cardio supposed to make you fat? Ooops, I mean lower RMR?

Study #6 – Sixty-five healthy, weight-stable women, aged 21-35 or 50-72 years, were studied: 12 premenopausal and 15 postmenopausal sedentary women, 13 premenopausal and 15 postmenopausal distance runners, and 10 endurance-trained postmenopausal swimmers. RMR was measured by indirect calorimetry (ventilated hood system) after an overnight fast, and values were adjusted for fat mass and fat-free mass. Our results are consistent with the concept that the age-related decline in RMR in sedentary women is not observed in women who regularly perform endurance exercise. The elevated level of RMR observed in middle-aged and older exercising women may play a role in their lower levels of body weight and fatness compared to those in sedentary women.[8] Wait, did I read that correctly? Women who performed dreaded cardio actually were able to fight the age-related drop in RMR.

Study #7 – This study investigated the effects of 12 weeks of aerobic exercise plus voluntary food restriction on the body composition, resting metabolic rate (RMR) and aerobic fitness of mildly obese middle-aged women. The exercise/diet group participated in an aerobic training rowingprogram, 45-60 minutes daily at 50%-60% of maximal oxygen uptake (VO2max), 3-4 days per week, and also adopted a self-regulated energy deficit relative to predicted energy requirements. After the regimen had been followed for 12 weeks, the body mass of the subjects had decreased by an average of 4.5 kg, due mainly to fat loss, with little change of fat free mass (mff). The absolute RMR did not change, but the experimental group showed significant increases in the RMR per unit of body mass (10%) and the RMR per unit of mff (4%). The increase in RMR/mff was not correlated with any increase in VO2max/mff. The resting heat production per unit of essential body mass increased by an average of 21%, but the resting heat production rate per unit of fat tissue mass remained unchanged. We concluded that aerobic exercise enhances the effect of moderate dietary restriction by augmenting the metabolic activity of lean tissue.[9] Huh? Regular aerobic exercise increases RMR per unit body weight. Get on that treadmill! Ok, not really. Treadmill running is as much fun as wrestling a porcupine.

This pic has nothing to do with cardio. Just thought you'd like it. :-)

This pic has nothing to do with cardio. Just thought you’d like it. :-)

Study #8 – Scientists examined the effect of a 12-wk endurance exercise training program on RMR and 2) to provide insight into the mechanisms responsible for alterations in RMR that may occur after exercise training. Male participants (19-32 years) in an exercise group (EX) performed jogging and/or running 3-4 days per week, 25-40 min per session, at 60%-80% VO2max, whereas subjects in a control group (CON) maintained their normal activity patterns. Body composition, VO2max, RMR, epinephrine, norepinephrine, total thyroxine, free thyroxine, insulin, free fatty acids, and glucose were measured before and after the intervention.Training resulted in a significant increase in VO2max in EX. Absolute and relative values for RMR did not significantly change in EX (endurance training group) after training. Mean values for epinephrine, norepinephrine, total thyroxine, insulin, and glucose did not significantly change in either group; however, free thyroxine decreased significantly after training in EX. Oddly enough, RMR in CON decreased significantly when expressed as an absolute value and relative to body weight, fat-free mass, and fat mass. The mechanism for the decrease in CON is unknown, but it may be related to seasonal variations in RMR. Training may have prevented a similar decline in RMR in EX and may be related to a training-induced increase in fat oxidation.[10]

Study #9 – We tested the hypothesis that resting metabolic rate (RMR) declines with age in physically active men (endurance exercise > or = 3 times/wk) and that this decline is related to weekly exercise volume (h/wk) and/or daily energy intake. Accordingly, scientists studied 137 suzy_favor_hamilton4-getty_1356117573_540x540healthy adult men who had been weight stable for 6 months or longer. What they found was fascinating: 1) RMR, per unit FFM, declines with age in highly physically active men; and 2) this decline is related to age-associated reductions in exercise volume and energy intake; 3) this does not occur in men who maintain exercise volume and/or energy intake at a level similar to that of young physically active men.[11] So that’s the secret. Exercise a lot (even cardio is good) and eat a lot. My kind of program!

Study #10Is a 1-year study long enough for you? Let’s find out. Seventeen sedentary participants completed a 12 months jogging/walking program, 3 days/week for 45 min/session at a constant heart rate (HR) prescription of 60% HR-reserve. That’s pretty easy cardio if you ask me! After 12 months of training, body weight remained unchanged; however, body fat was significantly reduced by 3.4 %. Neither RMR nor substrate oxidation at rest changed significantly. In summary one year of recreational endurance training does NOT negatively impact RMR.[12] I know I know. Naysayers will say “that study isn’t long enough.” “We need a 10 year study to verify these results.” Blah blah blah.

Study #11 – Scientists determined whether chronic (9 months) moderate-intensity exercise training changes resting metabolic rate (RMR) and substrate oxidation in overweight young adults. Participants were randomly assigned to non-exercise control (CON, 18 women, 15 men) or exercise (EX, 25 women, 16 men) groups. EX performed supervised and verified exercise 3-5 d/week, 20-45 min/session, at 60-75% of heart-rate reserve. Here’s what happened. EX men had significant decreases from baseline to 9 months in body mass (94.6 to 89.2 kg) and percent fat outrigger-canoe(28.3 to 24.5). CON women had significant increases in body mass (80.2 to 83.2 kg) from baseline to 16 months. VO2max increased significantly from baseline to 9 months in the EX men and women. RMR increased from baseline to 9 months in EX men and women. So there you have it. Regular moderate-intensity exercise in healthy, previously sedentary overweight and obese adults increases RMR but does not alter resting substrate oxidation. Women tend to have higher RMR and greater fat oxidation, when expressed per kilogram fat-free mass, than men.[13] That’s interesting. Women have a greater RMR per kg FFM than men. Hmmm. So women have no excuse for packing on the lbs. 😛

Study #12 – Maybe it does decrease RMR? Scientists examined the effects of exercise training on resting metabolic rate (RMR) in moderately obese women. Nineteen previously sedentary, moderately obese women (age = 38.0 years, percent body fat = 37.5) trained for 20 weeks using either resistance training (RT) or a combination of resistance training and walking (RT/W). The high intensity resistance-training program was designed to increase strength and fat-free mass and the walking program to increase aerobic capacity. There was also a non-exercising control Helga paddling SUPgroup (C) of 9 subjects in this study. Fat-free mass was significantly increased in both the RT (+1.90 kg) and RT/W (+1.90 kg) groups as a result of the training program. So apparently adding walking to weight training does not negatively impact gains in LBM. No group showed significant changes in fat mass or relative body fat from pre- to post-training. This runs counter to the ubiquitous advice of weight training being a superior method of achieving fat loss. Furthermore, aerobic capacity was slightly, though significantly, increased in the RT/W group only. The RT group showed a significant increase (+44 kcal per day), while the RT/W group showed a significant decrease (-53 kcal per day in resting metabolic rate post-training. RT can potentiate an increase in RMR through an increase in fat-free mass, and the decrease in RMR in the RT/W group may have been a result of heat acclimation from the walk training.[14] This study shows a difference. Though I’d posit that the lower RMR is made up for by the extra walking in the resistance training plus walking group. Besides, isn’t weight training supposed to combat the effects of a lower RMR?

So in conclusion: The preponderance of the evidence clearly shows that regular aerobic training has little to no effect on RMR. So you can put the notion of ‘cardio lowering RMR’ in the trash bin where it’ll join the ‘cardio makes you fat’ dopiness. So if you love cardio, keep doing it. It’s not going to ‘ruin’ your metabolism. If you want to increase RMR, then lift weights and gain LBM. On the other hand, if you exercise too much, eat too little, and lose body weight and lean body mass, then your RMR will drop. But who in their right mind does that?

BIO – Jose Antonio PhD is the CEO of the ISSN, www.issn.net and faculty at Nova Southeastern University in Exercise and Sports Science. I’m not fond of doing cardio in a gym. Why anyone would run on an indoor treadmill, do that silly elliptical or ride a bike (oh..I mean do Spinning classes…haha) in a room full of stinky people at your local gym is as puzzling as watching a fat man order a diet coke with a slice of cheesecake. Go outside for chrissakes. It’s a helluva lot more fun.

Paddle in VA Beach 2016 edited

References

1.         Taguchi M, Ishikawa-Takata K, Tatsuta W, Katsuragi C, Usui C, Sakamoto S, Higuchi M: Resting energy expenditure can be assessed by fat-free mass in female athletes regardless of body size. J Nutr Sci Vitaminol (Tokyo) 2011, 57:22-29.

2.         Deriaz O, Fournier G, Tremblay A, Despres JP, Bouchard C: Lean-body-mass composition and resting energy expenditure before and after long-term overfeeding. Am J Clin Nutr 1992, 56:840-847.

3.         Schmidt WD, Hyner GC, Lyle RM, Corrigan D, Bottoms G, Melby CL: The effects of aerobic and anaerobic exercise conditioning on resting metabolic rate and the thermic effect of a meal. Int J Sport Nutr 1994, 4:335-346.

4.         Tremblay A, Fontaine E, Poehlman ET, Mitchell D, Perron L, Bouchard C: The effect of exercise-training on resting metabolic rate in lean and moderately obese individuals. Int J Obes 1986, 10:511-517.

5.         Kraemer WJ, Volek JS, Clark KL, Gordon SE, Incledon T, Puhl SM, Triplett-McBride NT, McBride JM, Putukian M, Sebastianelli WJ: Physiological adaptations to a weight-loss dietary regimen and exercise programs in women. J Appl Physiol (1985) 1997, 83:270-279.

6.         Broeder CE, Burrhus KA, Svanevik LS, Wilmore JH: The effects of either high-intensity resistance or endurance training on resting metabolic rate. Am J Clin Nutr 1992, 55:802-810.

7.         Jennings AE, Alberga A, Sigal RJ, Jay O, Boule NG, Kenny GP: The effect of exercise training on resting metabolic rate in type 2 diabetes mellitus. Med Sci Sports Exerc 2009, 41:1558-1565.

8.         Van Pelt RE, Jones PP, Davy KP, Desouza CA, Tanaka H, Davy BM, Seals DR: Regular exercise and the age-related decline in resting metabolic rate in women. J Clin Endocrinol Metab 1997, 82:3208-3212.

9.         Shinkai S, Watanabe S, Kurokawa Y, Torii J, Asai H, Shephard RJ: Effects of 12 weeks of aerobic exercise plus dietary restriction on body composition, resting energy expenditure and aerobic fitness in mildly obese middle-aged women. Eur J Appl Physiol Occup Physiol 1994, 68:258-265.

10.       Lee MG, Sedlock DA, Flynn MG, Kamimori GH: Resting metabolic rate after endurance exercise training. Med Sci Sports Exerc 2009, 41:1444-1451.

11.       van Pelt RE, Dinneno FA, Seals DR, Jones PP: Age-related decline in RMR in physically active men: relation to exercise volume and energy intake. Am J Physiol Endocrinol Metab 2001, 281:E633-639.

12.       Scharhag-Rosenberger F, Meyer T, Walitzek S, Kindermann W: Effects of one year aerobic endurance training on resting metabolic rate and exercise fat oxidation in previously untrained men and women. Metabolic endurance training adaptations. Int J Sports Med 2010, 31:498-504.

13.       Potteiger JA, Kirk EP, Jacobsen DJ, Donnelly JE: Changes in resting metabolic rate and substrate oxidation after 16 months of exercise training in overweight adults. Int J Sport Nutr Exerc Metab 2008, 18:79-95.

14.       Byrne HK, Wilmore JH: The effects of a 20-week exercise training program on resting metabolic rate in previously sedentary, moderately obese women. Int J Sport Nutr Exerc Metab 2001, 11:15-31.


The King of All Ergogenic Aids


by Sérgio Fontinhas. What’s the best ergogenic aid? Is it creatine? Caffeine? Vitamin D?

If you answered ‘water,’ then you’re clearly a Mensa member.women-water-12

The human body is approximately 60% to 70% water (with a range of 45-75%) (1). It can be is less with increasing body fat because fat is known as “anhydrous” with about 10% water, however fat-free mass can be 70-80% water (1). An average 70-kg person has approximately 42 L of total body water, with a range of 31–51 L (1). Improper hydration will result in either dehydration or overhydration (hyponatremia). Daily water balance depends on the net difference between water gain and water loss.

Individuals are routinely at a risk of mild dehydration day to day (2). Public surveys (10,11) and experimental trials (12,13) indicate that the general public, and most importantly special populations such as children and older adults, are at a risk of voluntary dehydration (14,15). Even experienced athletes can underestimate their hydration status and may drink insufficient amounts of water resulting in sustained dehydration (16).

Sustained dehydration is associated with poor health (3,4) and increases the likelihood of kidney stones and urinary tract infection by a significant degree (3,5). Additionally, prolonged vasoconstriction due to chronic dehydration increase the risk of hypertension and stroke (6).

An emergent body of evidence also suggests water consumption (and the food we eat) affect mental and physical performance (7). Water is essential to the maintenance of normal physical and cognitive function (8), and there are some recommended intake guidelines of 2000 ml of fluids for females and 2500 ml for males per day (9). More specifically it is recommended 3.7 L for 70 kg males and 2.7 L for 57 kg females (29).

Water is the medium of circulatory function, biochemical reactions, metabolism, substrate transport across cellular membranes, temperature regulation, and numerous other physiological processes (28). The loss or increase in fluids and electrolytes (potassium, sodium, calcium, magnesium…) affects cellular performance, and can cause cell death, and even death of the entire organism.

Assessing hydration status – Individuals should monitor their own hydration levels using markers such as urine color (27). Although dilution methods to determine total body water via plasma osmolality measurement are the most accurate, valid, and sensitive ways, they are not practical for most situations (30,122), but total body mass and urine color when used in conjunction is a good way to assess hydration status (30,122).

First-morning urine should look like pale yellow (27), indicating the normal and expected presence of some waste products from metabolism overnight. This color corresponds to a state of euhydration (34,35). I shouldn´t look at water, or anything dark.

Thirst is initially perceived when a body weight deficit of 1–2% exists (36,37), fluid consumption should be adequate to avert the perception of thirst. Thirst signals any imbalances of the osmolality of fluids and tissues (the electrolyte concentration), and the total amount of water in our body (volume).

Dehydration – Dehydration is characterized by weight loss, confusion, dry skin that is hot to the touch, and possibly an elevated core body temperature. In a hot climate, dehydration can be dangerous and result in thermal injury. Other causes of dehydration can be excess diarrhea, vomiting due to GI dysfunction, kidney disease, and diuretic medications.

9011366123307

Thirst may be a poor measure of hydration because of the lag between the physiological dehydration and the thirst signal. Special populations require more attention, elderly are less sensitive to the thirst mechanism the deterioration of osmoreceptor sensitivity in older adults (30,38,39,40,121); and children are inexperienced in interpreting the thirst response (41,42). Older adults are also at higher risk for reduced kidney filtration function, which results in less efficient water conservation (when dehydrated), further exacerbating difficulties in recognizing a dehydrated state (43).

Physiology of dehydration / physiological response

When the body is in a state of dehydration, many substrates and neurotransmitters are influenced by circulating vasopressin (antidiuretic hormone) and angiotensin II (44,45).  Dehydration can increase levels of cortisol (46). Interestingly, even a decrease in cell volume caused by hypohydration promotes insulin resistance (47,48,49).

Conditions dehydrating insulin target tissues such as hyperosmolarity or amino acid deprivation are associated with insulin resistance; blockage of the cell volume response to insulin may be the common denominator in dehydration-induced insulin resistance (47).

As a consequence of dehydration, the blood–brain barrier permeability is altered by serotonergic and dopaminergic systems, potentially causing central nervous system dysfunction if dehydration is prolonged (50).  Chronic dehydration influence inhibitory and excitatory activities of the brain by increasing aminobutyric acid and glutamate levels (51), by stimulating γ-aminobutyric acid and N-methyl-D-aspartate receptors, to synthesize and release antidiuretic hormone (56).

Even mild dehydration produces significant changes at the neural level: total brain volume shrinkage and over-recruitment of specific brain areas during cognitively demanding tasks (52).

Hypohydration and exercise

Hypohydration during exercise strongly rises the catabolic hormonal response to resistance exercise, and increase circulating concentrations of metabolic substrates. Hydration status during exercise changes the endocrine and metabolic adaptive responses to resistance exercise and also changes the postexercise internal environment. Specifically, there’s increase in cortisol, epinephrine, and norepinephrine (46).

Hypohydration stimulates the catabolic hormones by increasing core temperature (69,70) and increases cardiovascular demand due to decreased plasma volume (71,72,73). A 3% to 4% loss of body weight (water) reduces strength by about 2% and power by about 3% (35).

As noted before, a decrease in cell volume caused by hypohydration promotes insulin resistance (47,48,49). Resistance exercise might exacerbate the effects of hypohydration on insulin resistance, because muscle damage is also related with insulin resistance (74,75,76,77). There’s decreased GLUT-4 protein content (78,79), and impaired insulin signal transduction at the level of IRS-1, PI 3-kinase, and Akt-kinase (75). Downhill treadmill running and resistance exercise result in transient insulin resistance (80,81,82), and the reductions in glucose uptake in muscle damage models may be of the order of 20–30% (78,80).Muscle damage and insulin resistance


(74).

Hyponatremia – Extreme exercise conditions (equal or above three hours continuously), such as the marathon or triathlon, without the intake of electrolytes increase the risk dehydration or hyponatremia (83). Symptomatic hyponatremia is typically observed with greater than 6 hours of prolonged exercise. Acute water toxicity happens due to rapid consumption of large quantities of water that greatly exceeded the kidney’s maximal excretion rate (from 0.7 to 1.0 L/hour) (1).

Severe exercise-associated hyponatremia (EAH) starts as significant mental status changes resulting from cerebral edema, at times associated with noncardiogenic pulmonary edema (84,85). The osmotic imbalance results in fluid movement into the brain, causes swelling, which then leads to disorientation, confusion, general weakness, grand mal seizures, coma, and possibly death (35,124,125,126).

Exercise-associated hyponatremia (EAH) typically occurs during or up to 24 hours after prolonged physical activity, and is defined by a serum or plasma sodium concentration below the normal reference range of 135 mEq/L (86,87).

Usually only less than 1% of marathons athletes present signs of EAH (88,89), however it was as high as 23% in an Ironman Triathlon (90) and 38% in runners participating in a marathon and ultramarathon in Asia (91). There’s also now a trend for symptomatic EAH for shorter distance events, such as a half marathon (92) and sprint triathlon taking approximately 90 minutes to complete (93). There’s also no statistical significance for the incidence of symptomatic between genders (55), though women may be at greater risk than men (55).

We have seen that the major risk factor for developing EAH is excessive water intake beyond the capacity for renal water excretion (1,100,101) largely as a result of persistent secretion of arginine vasopressin (102,103). Elevations in brain natriuretic peptide (NT-BNP) may lead to excessive losses of urine sodium and raise the risk of hyponatremia (104).

Another concern is the inability to mobilize body sodium bound in bone. Sodium can be released from internal stores such as bone (105,106,107), 25% of body sodium is bound in bone (osmotically inactive) and is potentially recruitable. Inability to recruit sodium from that pool may increase the risk of hyponatremia.

Individuals under normal conditions are able to excrete between 500 and 1000 mL/h of water (108), plus the non-renal losses of water as sweat, so athletes should be able to consume as much as 1000 to 1500 ml/h before developing water retention and dilutional hyponatremia, therefore it seems likely that excessive water intake (>1500 mL/h) is the main cause.

The combination of excessive water intake and inappropriate AVP secretion will clearly lead to hyponatremia.exercise associated hyponatremia pathogenesis


(86)

Arginine vasopressin (AVP) must be suppressed appropriately with water loading, otherwise the ability to produce dilute urine is markedly impaired (109).

Water can also be absorbed from the gastrointestinal tract at the end of a race causing an acute drop in serum sodium concentration (110), with clinical signs of EAHE after 30 minutes. During exercise, breakdown of glycogen into lactate increases cellular osmolality and rises serum sodium, but some minutes after exercise this is reversed and serum sodium levels drop (111,112).

The risk also rises if the degree of fluid loss through sweat is sufficient to produce significant volume depletion (stimulating AVP release and impairing urine excretion of water), coupled with ingestion of hypotonic fluids (86).

Although not conclusive, nonsteroidal anti-inflammatory drugs (NSAIDs) have been implicated as a risk factor in the development of EAH by potentiating the water retention effects of AVP at the kidney (86).

At least two strategies can be used to present EAH: avoid overdrinking (real time sensation of thirst) and limiting the availability of fluids during events. Supplementation with sodium may delay of even prevent the decline in blood sodium concentration (113,114) however drinking beyond thirst (overdrinking) will not prevent hyponatremia (115), the amount of fluid ingested is more important than the amount of sodium ingested for blood sodium concentrations (116).

EAH has a complex pathogenesis and multifactorial etiology:exercise associated hyponatremia field management (1)


 (86)


An athlete should consume approximately 500 to 600 mL (17 to 20 fl oz) of water 2 to 3 hours before exercise (117). By hydrating several hours prior to the exercise, there is sufficient time for urine output to return toward normal before starting the event (30).

For normal athletic events in moderate temperatures (and altitudes), it should be enough to hydrate slowly over several hours. If the body needs water urgently it can absorb some water right through the walls of the stomach. A 1% to 2% decrease in your body weight (due to water loss) will affect performance.

The threshold for reduced performance appears to be 2% body water loss of total body mass (118,119). Dehydration equivalent to 1.5% to 2% of total body mass may decrease performance up to 15% (120). We’ve seen before that 3% to 4% losses impairs muscular strength by 2% and muscular power by 3% (35), and also reduces high-intensity endurance performance (e.g., distance running) by approximately 10% (123).

Energy drinks

Energy drinks typically contain water, carbohydrates, vitamins, minerals, with the aim of increasing energy, alertness, metabolism, and/or performance (e.g., caffeine, taurine, amino acids, glucoronolactone…) (127).

Caffeine is the most common ingredient, and is absorbed in 30 – 60 minutes (128). Caffeine original_238495_hro087gobfL4M69kTZcwERglvstimulates the cardiovascular system and increases epinephrine output (129,130); enhance vigilance during bouts of exhaustive exercise, and periods of sustained sleep deprivation. Energy drinks with approximately 2 mg·kgBM-1caffeine consumed 10 to 60 minutes prior to anaerobic/resistance exercise may improve upper- and lower- body total lifting volume, and improve cycling and running performance (127).

Carbohydrate feeding during exercise can improve endurance capacity and performance (131,132), through maintenance of blood glucose levels, high levels of carbohydrate oxidation (1 g of carbohydrate per minute), while sparing liver and skeletal muscle glycogen (133).

Energy drinks also have a small amount of vitamins (e.g., Vitamin B6, Vitamin B12, pantothenic acid, Vitamin C) and electrolytes (e.g., sodium, potassium, phosphorus, etc.).

Energy drinks can improve mood, reaction time, and/or markers of alertness, most likely due to the ergogenic value of caffeine and/or carbohydrate.

Caffeine can elevate metabolic rate and the rate of lipolysis. 200-500 mg of caffeine (typical of thermogenic supplements) can increase acute energy expenditure (1-24 hours) (127), chronic energy expenditure (28 days) (134), and elevate plasma free-fatty acid, glycerol levels and catecholamine secretion (127, 134). The caffeine in energy drinks ranges from 80-200 mg, and it’s not conclusive whether daily use of ED would affect long-term energy balance and body composition (127).

Individuals with metabolic syndrome and or diabetes mellitus should avoid consumption of high glycemic drinks and/or foods. More importantly, individuals with known cardiovascular disease should avoid any use of energy drinks due to the cardio stimulant effects (124).

More references here than there are chopsticks in a Chinese restaurant

1. Institute of medicine. Water. In: Dietary Reference Intakes for Water, Sodium, Chloride, Potassium and Sulfate, Washington, D.C: National Academy Press, pp. 73–185, 2005.


2. Greenleaf JE & Sargent F (1965). Voluntary dehydration in man. J Appl Physiol 20, 719–724


3. Popkin B, D’Anci K & Rosenberg I (2010). Water, hydration and health. Nutr Rev 68, 439–458.


4. Wilson MM & Morley JE (2003) Impaired cognitive function and mental performance in mild dehydration. Eur J Clin Nutr 57, S24–S29.


5. Jequier E & Constant F (2010). Water as an essential nutrient: the physiological basis of hydration. Eur J Clin Nutr 64, 115–123.


6. Thornton SN (2010). Thirst and hydration: physiology and consequences of dysfunction. Physiol Behav 100, 15–21.


7. Gomez-Pinilla F (2008). Brain foods: the effects of nutrients on brain function. Nat Rev Neurosci 9, 568–578.


8. EFSA (2011) Scientific opinion on the substantiation of health claims related to water and maintenance of normal physical and cognitive functions (ID 1102, 1294, 1331), maintenance of normal thermoregulation (ID 1208) and “basic requirement of all living things” (ID 1207) pursuant to Article 13(1) of Regulation

(EC) No. 1924/2006. EFSA J 9, 2075.


9. EFSA (2010). Scientific opinion on dietary reference values for water: EFSA panel on dietetic products, nutrition, and allergies (NDA). EFSA J 8, 1459.


10. Gandy J (2012). First findings of the United Kingdom fluid intake study. Nutr Today 47, S14–S16.


11. Gibson S, Gunn P & Maughan RJ (2012). Hydration, water intake and beverage consumption habits among adults. Nutr Bull 37, 182–192.


12. Bar-David Y, Urkin J, Bar-David Z, et al. (2009). Voluntary dehydration among elementary school children residing in a hot arid environment. J Hum Nutr Diet 22, 455–460.


13. Fadda R, Rapinett G, Grathwohl D, et al. (2012). Effects of drinking supplementary water at school on cognitive performance in children. Appetite 59, 730–737.


14. Greenleaf JE (1992). Problem: thirst, drinking behavior, and involuntary dehydration. Med Sci Sports Exerc 24, 645–656.


15. Greenleaf JE & Sargent F (1965). Voluntary dehydration in man. J Appl Physiol 20, 719–724.


16. Passe D, Horn M, Stofan J, et al. (2007). Voluntary dehydration in runners despite favorable conditions for fluid intake. Int J Sport Nutr Exerc Metab 17, 284–295.


27. Lawrence E. Armstrong (2005). Hydration assessment techniques. NutrRev 63, S40–S54.


28. Lawrence E. Armstrong. Assessing Hydration Status: The Elusive Gold Standard. J Am Coll Nutr. 2007 Oct;26(5 Suppl):575S-584S.


29. Institute of Medicine and Food and Nutrition Board. In: “Dietary Reference Intakes for Water, Potassium, Sodium, Chloride and Sulfate.” Washington, DC: National Academies Press. pp 73–185, 2004.


30. Sawka MN, Burke LM, Eichner ER, Maughan RJ, Montain SJ, Stachenfeld NS. American College of Sports Medicine position stand. Exercise and fluid replacement. American College of Sports Medicine. Med Sci Sports Exerc. 2007 Feb;39(2):377-90.


34. Armstrong LE, Soto JA, Hacker FT Jr, Casa DJ, Kavouras SA, Maresh CM: Urinary indices during dehydration, exercise, and rehydration. Int J. Sport Nutr 8:345–355, 1998.


35. Armstrong LE, Maresh CM, Castellani JW, Bergeron MF, Kenefick RW, LaGasse KE, Riebe D: Urinary Indices of Hydration Status. Int J Sport Nutr 4:265–279, 1994.


36. Greenleaf JE, Morimoto T: Mechanisms controlling fluid ingestion: thirst and drinking. In Buskirk ER, Puhl SM (eds): “Body Fluid Balance: Exercise and Sport.” Boca Raton, FL: CRC Press,1996.


37. Hubbard RW, Szlyk PC, Armstrong LE: Influence of thirst and fluid palatability on fluid ingestion during exercise. In Gisolfi CV, Lamb DR (eds): “Perspectives in Exercise Sciences and Sports Medicine. Fluid Homeostasis During Exercise.” Indianapolis: Benchmark Press Inc, 1990.


38. Begum MN & Johnson CS (2010) A review of the literature on dehydration in institutionalized elderly. e-Spen Eur e-J Clin Nutr Metab 5, e47–e53.


39. Mentes J (2006). Oral hydration in older adults: greater awareness is needed in preventing, recognizing, and treating dehydration. Am J Nurs 106, 40–49.


40. Rolls BJ & Phillips PA (2009). Aging and disturbances of thirst and fluid balance. Nutr Rev 48, 137–144.


41. D’Anci K, Constant F & Rosenberg I (2006). Hydration and cognitive function in children. Nutr Rev 64, 457–464.


42. Kenney WL & Chiu P (2001). Influence of age on thirst and fluid intake. Med Sci Sports Exerc 33, 1524–1532


43. Mentes J (2006). Oral hydration in older adults: greater awareness is needed in preventing, recognizing, and treating dehydration. Am J Nurs 106, 40–49.


44. Wilson MM & Morley JE (2003) Impaired cognitive function and mental performance in mild dehydration. Eur J Clin Nutr 57, S24–S29.


45. Bourque CW (2008) Central mechanisms of osmosensation and systemic osmoregulation. Nat Rev Neurosci 9, 519–531.


46. Daniel A. Judelson , Carl M. Maresh , Linda M. Yamamoto , Mark J. Farrell , Lawrence E. Armstrong , William J. Kraemer , Jeff S. Volek , Barry A. Spiering , Douglas J. Casa , Jeffrey M. Anderson. Effect of hydration state on resistance exercise-induced endocrine markers of anabolism, catabolism, and metabolism. Journal of Applied Physiology Published 1 September 2008Vol. 105no. 3, 816-824


47. Schliess F, Ha¨ussinger D. Cell hydration and insulin signaling. Cell Physiol Biochem 10: 403–408, 2000.


48. Schliess F, Ha¨ussinger D. Cell volume and insulin signaling. Int Rev Cytol 225: 187–228, 2003.


49. Schliess F, von Dahl S, Ha¨ussinger D. Insulin resistance induced by loop diuretics and hyperosmolarity in perfused rat liver. Biol Chem 382:1063–1069, 2001.


50. Maughan R, Shirreffs S & Watson P (2007) Exercise, heat, hydration and the brain. J Am Coll Nutr 26, 604S–612S.


51. Di S & Tasker J (2004) Dehydration-induced synaptic plasticity in magnocellular neurons of the hypothalamus supraoptic nucleus. Endocrinology 145, 5141–5149.


52. Kempton MJ, Ettinger U, Foster R, et al. (2011) Dehydration affects brain structure and function in healthy adolescents.Hum Brain Mapp 32, 71–79.


55. Almond, Christopher; Shin, Andrew (2005). Hyponatremia among runners in the Boston Marathon. N Engl J Med 352 (15): 1550


56. Babar, S. (October 2013). “SIADH Associated With Ciprofloxacin.”. The Annals of Pharmacotherapy 47 (10): 1359–1363.


69. Mitchell JB, Dugas JP, McFarlin BK, Nelson MJ. Effect of exercise, heat stress, and hydration on immune cell number and function. Med Sci Sports Exerc 34: 1941–1950, 2002.


70. Powers SK, Howley ET, Cox R. A differential catecholamine response during prolonged exercise and passive heating. Med Sci Sports Exerc 14: 435–439, 1982.


71. Roy BD, Green HJ, Burnett M. Prolonged exercise following diuretic induced hypohydration effects on fluid and electrolyte hormones. Horm Metab Res 33: 540–547, 2001.


72. Roy BD, Green HJ, Burnett ME. Prolonged exercise following diuretic induced hypohydration: effects on cardiovascular and thermal strain. Can J Physiol Pharmacol 78: 541–547, 2000.


74. Tee JC, Bosch AN, Lambert MI. Metabolic consequences of exercise induced muscle damage. Sports Med 37: 827–836, 2007.


75. Del Aguila LF, Krishnan RK, Ulbrecht JS, Farrell PA, Correll PH, Lang CH, Zierath JR, Kirwan JP. Muscle damage impairs insulin stimulation of IRS-1, PI 3-kinase, and Akt-kinase in human skeletal muscle. Am J Physiol Endocrinol Metab 279: E206–E212, 2000


76. Kirwan JP, Del Aguila LF. Insulin signalling, exercise and cellular integrity. Biochem Soc Trans 31: 1281–1285, 2003.


77. Kirwan JP, Hickner RC, Yarasheski KE, Kohrt WM, Wiethop BV, Holloszy JO. Eccentric exercise induces transient insulin resistance in healthy individuals. J Appl Physiol 72: 2197–2202, 1992.


78. Asp S, Daugaard JR, Kristiansen S, Kiens B, and Richter EA. Eccentric exercise decreases maximal insulin action in humans:muscle and systemic effects. J Physiol (Lond) 494: 891–898, 1996.


79. Asp S, Kristiansen S, and Richter EA. Eccentric muscle damage transiently decreases rat skeletal muscle GLUT-4 protein. J Appl Physiol 79: 1338–1345, 1995.


80. Kirwan JP, Hickner RC, Yarasheski KE, Kohrt WM, Wiethop BV, and Holloszy JO. Eccentric exercise induces transient insulin resistance


81. Kirwan JP, Bourey RE, Kohrt WM, Staten MA, and Holloszy JO. Effects of treadmill exercise to exhaustion on the insulin response to hyperglycemia in untrained men. J Appl Physiol 70: 246–250, 1991.


82. Krishnan RK, Hernandez JM, Williamson DL, O’Gorman DJ, Evans WJ, and Kirwan JP. Age-related differences in the pancreatic b-cell response to hyperglycemia after eccentric exercise. Am J Physiol Endocrinol Metab 275: E463–E470, 1998.


83. J,Estevez E,Baquero E,Mora-Rodriguez R (2008). “Anaerobic performance when rehydrating with water or commercially available sports drinks during prolonged exercise in the heat”. Applied Physiology, Nutrition and Metabolism 33 (2): 290–298.


84. Rosner MH. Exercise-associated hyponatremia. Semin Nephrol . 2009;29:271–281.


85. Rosner MH, Bennett B, Hew-Butler T, Hoffman MD. Exercise induced hyponatremia. In: Simon EE, ed. Hyponatremia: Evaluation and Treatment . New York, NY: Springer; 2013


86.  Bennett, BL; Hew-Butler, T; Hoffman, MD; Rogers, IR; Rosner, MH (Sep 2013). “Wilderness Medical Society practice guidelines for treatment of exercise-associated hyponatremia.”. Wilderness & environmental medicine 24 (3): 228–40.


87. Hew-Butler T, Ayus JC, Kipps C, et al. Statement of the Second International Exercise-Associated Hyponatremia Consensus Development Conference, New Zealand, 2007. Clin J Sport Med. 2008;18:111–121.


88. Hew TD, Chorley JN, Cianca JC, Divine JG. The incidence, risk factors, and clinical manifestations of hyponatremia in marathon runners. Clin J Sport Med . 2003;13:41–47.


89. Davis DP, Videen JS, Marino A, et al. Exercise-associated hyponatremia in marathon runners: a two-year experience.J Emerg Med. 2001;21:47–57.


90. Speedy DB, Noakes TD, Rogers IR, et al. Hyponatremia in ultra-distance triathletes. Med Sci Sports Exerc. 1999;31:809–815.


91. Lee JK, Nio AQ, Ang WH, et al. First reported cases of exercise-associated hyponatremia in Asia. Int J Sports Med . 2011;32:297–302.


92. Glace B, Murphy C. Severe hyponatremia develops in a runner following a half-marathon. JAAPA . 2008;21:27–29


93. Shapiro SA, Ejaz AA, Osborne MD, Taylor WC. Moderate exercise-induced hyponatremia.Clin J Sport Med . 2006;16:72–73


100. Speedy DB, Noakes TD, Boswell T, Thompson JM, Rehrer N, Boswell DR. Response to a fluid load in athletes with a history of exercise induced hyponatremia. Med Sci Sports Exerc. 2001;33:1434 –1442.


101. Noakes TD, Wilson G, Gray DA, Lambert MI, Dennis SC. Peak rates of diuresis in healthy humans during oral fluid overload. S Afr Med J. 2001;91:852– 857.


102. Rosner MH, Kirven J. Exercise-associated hyponatremia. Clin J Am Soc Nephrol. 2007;2:151–161.


103. Rosner MH. Exercise-associated hyponatremia. Semin Nephrol. 2009;29:271–281.


104. Hew-Butler T, Jordaan E, Stuempfle KJ, et al. Osmotic and nonosmotic regulation of arginine vasopressin during prolonged endurance exercise. J Clin Endocrinol Metab. 2008;93:2072–2078.


105. Noakes TD, Sharwood K, Speedy D, et al. Three independent biological mechanisms cause exercise-associated hyponatremia: evidence from 2,135 weighed competitive athletic performances. Proc Natl Acad Sci U S A. 2005; 102:18550 –18555.


106. Edelman IS, James AH, Brooks L, Moore FD. Body sodium and potassium. IV. The normal total exchangeable sodium; its measurement and magnitude. Metabolism. 1954;3:530 –538.


107. Edelman IS, James AH, Baden H, Moore FD. Electrolyte composition of bone and the penetration of radio sodium and deuterium oxide into dog and human bone. J Clin Invest. 1954;33:122–131.


108. Rose BD, Post TW. Clinical Physiology of Acid-Base and Electrolyte Disorders. 5th ed. New York, NY: McGraw Hill; 2001.


109. Siegel AJ, Verbalis JG, Clement S, et al. Hyponatremia in marathon runners due to inappropriate arginine vasopressin secretion. Am J Med. 2007;120:461.e11-e17.


110. Ayus JC, Varon J, Arieff AI. Hyponatremia, cerebral edema, and noncardiogenic pulmonary edema in marathon runners. Ann Intern Med. 2000;132:711–714.


111. Halperin ML, Kamel KS, Sterns R. Hyponatremia in marathon runners. N Engl J Med. 2005;353:427– 428.


112. Lindinger MI, Heigenhauser GJ, McKelvie RS, Jones NL. Blood ion regulation during repeated maximal exercise and recovery in humans. Am J Physiol. 1992;262(1 Pt 2):R126–R136.


113. Barr SI, Costill DL, Fink WJ. Fluid replacement during prolonged exercise: effects of water, saline, or no fluid. Med Sci Sports Exerc. 1991;23:811– 817.


114. Vrijens DM, Rehrer NJ. Sodium-free fluid ingestion decreases plasma sodium during exercise in the heat. J Appl Physiol. 1999;86:1847–1851.


115. Hew-Butler TD, Sharwood K, Collins M, Speedy D, Noakes T. Sodium supplementation is not required to maintain serum sodium concentrations during an Ironman triathlon. Br J Sports Med. 2006;40:255–259.


116. Weschler LB. Exercise-associated hyponatraemia: a mathematical review. Sports Med. 2005;35:899 –922


117. Casa, Douglas J., Armstrong, Lawrence E., Hillman, Susan K., Montain, Scott J. (2000). National Athletic Trainers’ Association Position Statement: Fluid replacement for athletes. Journal of Athletic Training, 35(2), 212-224.


118. Baker LB, Dougherty KA, Chow M, et al. Progressive dehydration causes a progressive decline in basketball skill performance. Med Sci Sports Exerc. 2007;39:1114–1123.


119. Hoffman JR, Stavsky H, Falk B. The effect of water restriction on anaerobic power and vertical jumping height in basketball players. Int J Sports Med. 1995;16:214–218.


120. Edwards AM, Mann ME, Marfell-Jones MJ, et al. Influence of moderate dehydration on soccer performance: physiological responses to 45 min of outdoor match-play and the immediate subsequent performance of sport-specific and mental concentration tests. Br J Sports Med. 2007;41:385–391.


121. Binkley HM, Beckett J, Casa DJ, et al. National Athletic Trainers’ Association position statement: exertional heat illnesses. J Athl Train. 2002;37:329–343.


122. Sawka M, Burke LM, Eicher ER, et al. Exercise and fluid replacement. Med Sci Sports Exerc. 39:377–390.


123. Judelson DA, Maresh CM, Anderson JM, et al. Hydration and muscular performance. Does fluid balance affect strength, power and high-intensity endurance? Sports Med. (New Zealand). 2007;37:907–921.


124. Convertino V, Armstrong LE, Coyle EF, et al. ACSM position stand: exercise and fluid replacement. Med Sci Sports Exerc. 1996;28:i–ix.


125. Coyle EF. Fluid and fuel intake during exercise. J Sports Sci. 2004;22:39–55.


126. Maughn R, Burke LM, Coyle EF, eds. Food, Nutrition and Sports Performance II. The International Olympic Committee Consensus on Sports Nutrition. London: Routledge, 2004.


127. Bill Campbell, Colin Wilborn, Paul La Bounty, Lem Taylor, Mike T Nelson, Mike Greenwood, Tim N Ziegenfuss, Hector L Lopez, Jay R Hoffman, Jeffrey R Stout, Stephen Schmitz, Rick Collins, Doug S Kalman, Jose Antonio and Richard B Kreider. International Society of Sports Nutrition position stand: energy drinks. Journal of the International Society of Sports Nutrition 2013, 10:1


128. Goldstein ER, Ziegenfuss T, Kalman D, Kreider R, Campbell B, Wilborn C, Taylor L, Willoughby D, Stout J, Graves BS, et al: International society of sports nutrition position stand: caffeine and performance. J Int Soc Sports Nutr 2010, 7:5.


129. Graham TE, Hibbert E, Sathasivam P: Metabolic and exercise endurance effects of coffee and caffeine ingestion. J Appl Physiol 1998, 85:883–889.


130. McLellan TM, Bell DG: The impact of prior coffee consumption on the subsequent ergogenic effect of anhydrous caffeine. Int J Sport Nutr Exerc Metab 2004, 14:698–708.


131. Jeukendrup A, Brouns F, Wagenmakers AJ, Saris WH: Carbohydrate-electrolyte feedings improve 1 h time trial cycling performance. Int J Sports Med 1997, 18:125–129.


132. Jeukendrup AE: Carbohydrate intake during exercise and performance. Nutrition 2004, 20:669–677.


133. Coyle EF, Coggan AR, Hemmert MK, Ivy JL: Muscle glycogen utilization during prolonged strenuous exercise when fed carbohydrate. J Appl Physiol 1986, 61:165–172.


134. Roberts MD, Dalbo VJ, Hassell SE, Stout JR, Kerksick CM: Efficacy and safety of a popular thermogenic drink after 28 days of ingestion. J Int Soc Sports Nutr 2008, 5:19.